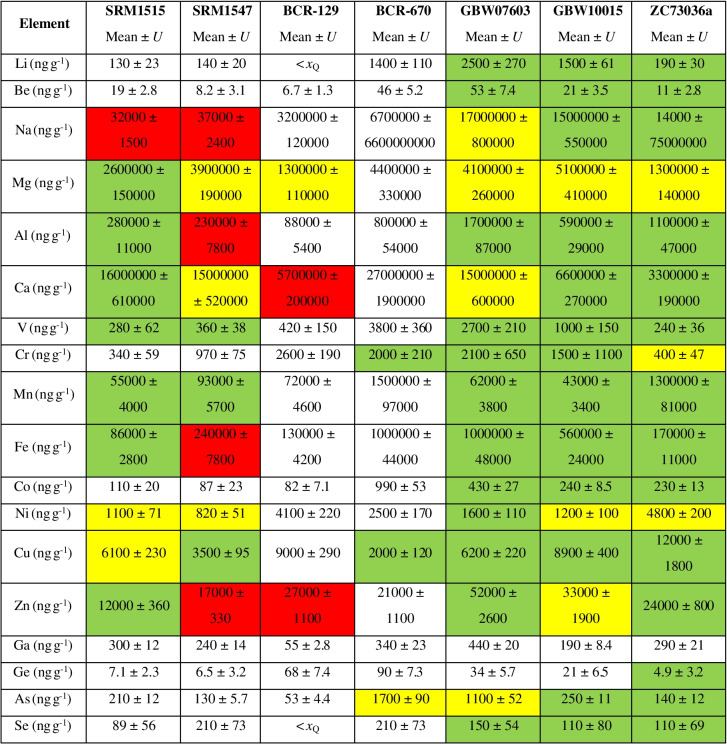
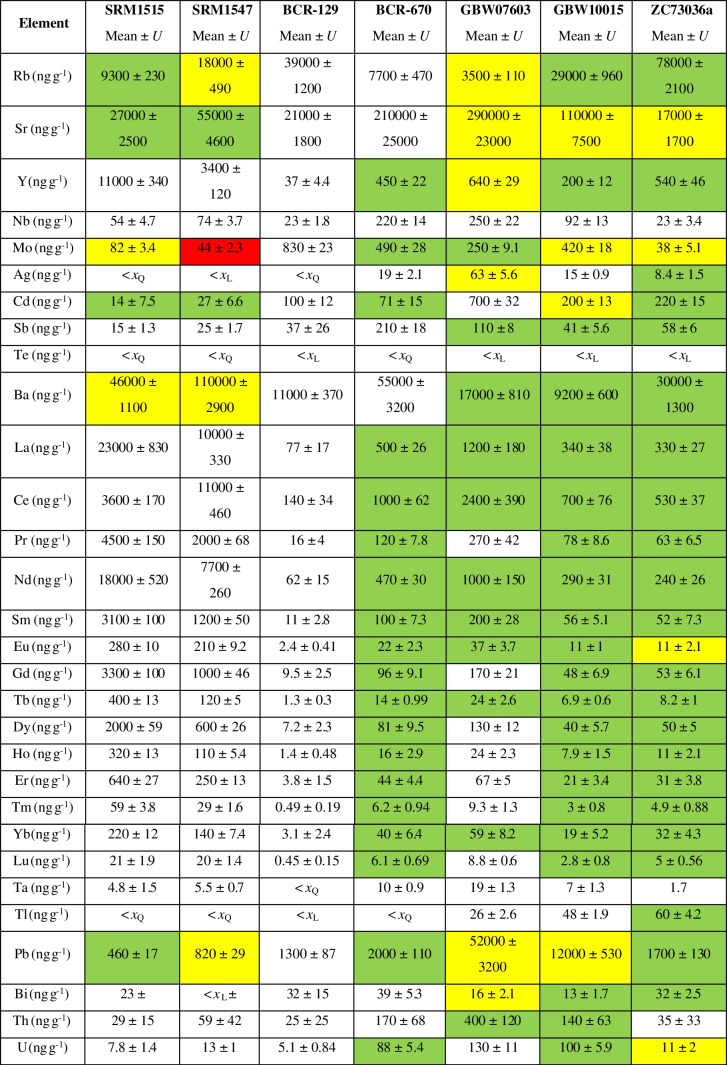
Table 1.
Mean analytical results for 48 analytes in 7 plant CRMs in ng g−1. Total combined uncertainties U, combining measurement uncertainty and variability between replicates, are given with a coverage factor of 2 (k = 2). Results below the limit of detection (quantification) are indicated with < xL (< xQ). Colours give an indication about closeness of agreement with the certified reference value, where available, by measure of the En numbers. Green: ∣En∣ < 1; yellow: 1 < ∣En∣ < 2; red: ∣En∣ > 2


