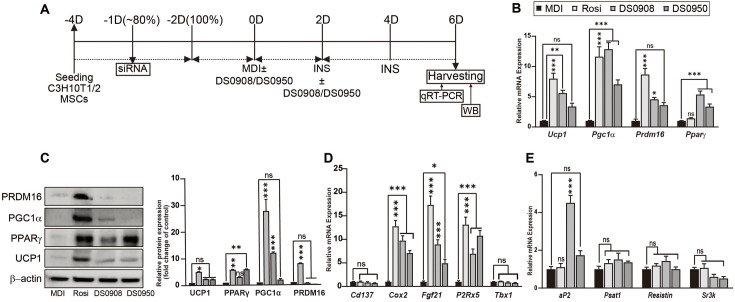
Fig. 1. Effect of B. bifidum DS0908 (DS0908) and B. longum DS0950 (DS0950) treatment on thermogenesis in C3H10T1/2 MSCs.
(A) Schematic representation of C3H10T1/2 MSCs differentiation timeline. (B) mRNA expression levels of the major thermogenic markers Ucp1, Pgc1α, Prdm16 and Pparγ after DS0908 and DS0950 treatment in differentiated C3H10T1/2 mesenchymal stem cells (MSCs). (C) Thermogenic marker UCP1, PPARγ, PGC1α and PRDM16 protein expression levels after DS0908 and DS0950 treatments in differentiated C3H10T1/2 MSCs. (D and E) mRNA expression levels of beige (Cd137, Fgf21, P2rx5 and Tbx1), brown (Cox2) and white (aP2, Psat1, Resistin and Serpina3k) adipocyte-specific markers after DS0908 and DS0950 treatments in differentiated C3H10T1/2 MSCs. Tbp was used as an internal control gene and β‐actin as a protein loading control. The data from three individual experiments are expressed as the average ± standard error mean (SEM). *, **, *** and ns indicate p < 0.05, < 0.01, < 0.001 and non-significant, respectively, to express the statistically significant differences between the control (MDI) and the treatment groups in the figures. The protein band intensities were measured using ImageJ. Adipogenic differentiation medium, MDI: 0.5mM IBMX, 1 μM dexamethasone and 10 μg/ml insulin; 1 μM Rosiglitazone (Rosi); DS0908 = B. bifidum DS0908; DS0950 = B. longum DS0950.

