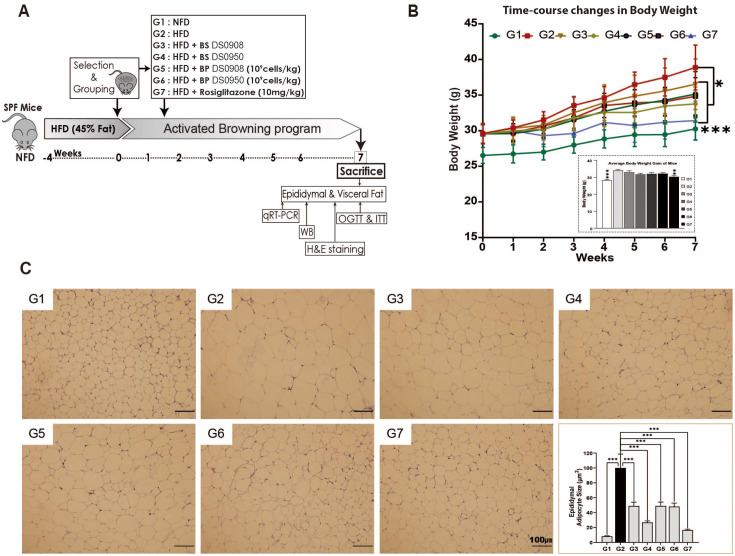
Fig. 2. DS0908 and DS0950 supplementation reduce bodyweight and fat accumulation without altering food intake in mice with HFD-induced obesity.
(A) Illustration of the dietary intervention timeline of mice with high-fat diet (HFD)-induced obesity and treatment group designs (n = 8 mice/per group). (B) Change in body weight growth curve with the average of whole-body weight gain after seven weeks in DS0908- and DS0950-administered mice with HFD-induced obesity compared to control mice group (NFD). (C) Haematoxylin and eosin (H&E) staining images of epididymal adipose tissue and lipid droplet area quantification among tissues from different mouse groups. The data are expressed as the average ± standard error mean (SEM). *, **, *** and ns indicate p < 0.05, < 0.01, < 0.001 and non-significant, respectively, to express the statistically significant differences between the control (G2: HFD) and treatment groups. G1: Normal-fat diet (NFD); G2: High-fat diet (HFD); G3: BS DS0908 (DS0908); G4: BS DS0950 (DS0950); G5: BP DS0908 (DS0908; 109 cells/kg); G6: BP DS0950 (DS0950; 109 cells/kg); G7: Rosiglitazone (Rosi; 10 mg/kg); BS = bacterial supernatant; BP = bacterial pellets.

