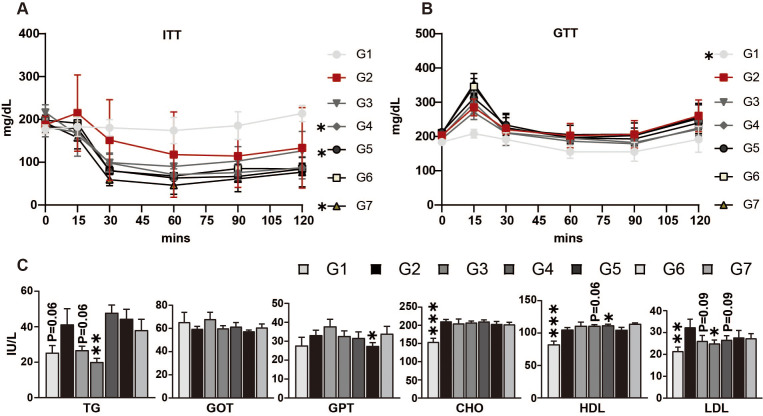
Fig. 3. Effect of DS0908 and DS0950 supplementation on insulin tolerance, glucose utilization, and hormonal changes in mice with HFD-induced obesity.
(A and B) Glucose and insulin uptake measurements in DS0908- and DS0950-administered mice with HFD-induced obesity. After six weeks, four mice from each group were selected and fasted for 16 h (OGTT) and 5 h (ITT), respectively. Before glucose (OGTT) or insulin (ITT) injection, blood was collected as a baseline control at 0 min, and then after glucose or insulin injection, blood glucose levels were measured at 15, 30, 60, 90, and 120 min. (C) Total triglyceride and cholesterol level (TG, HDL, and LDL) measurements and essential marker changes (GOT, GPT and CHO) in DS0908- and DS0950-administered mice with HFD-induced obesity. The data are expressed as the average ± standard error mean (SEM). *, **, ***and ns indicate p < 0.05, < 0.01, < 0.001 and non-significant, respectively, to express the statistically significant differences between the control (G2: HFD) and treatment groups. G1: Normal-fat diet (NFD); G2: High-fat diet (HFD); G3: BS DS0908 (DS0908); G4: BS DS0950 (DS0950); G5: BP DS0908 (DS0908; 109 cells/kg); G6: BP DS0950 (DS0950; 109 cells/kg); G7: Rosiglitazone (Rosi; 10 mg/kg); BS = bacterial supernatant; BP = bacterial pellets; TG = triglyceride; HDL = high-density lipoprotein; LDL = low-density lipoprotein; GOT = glutamic oxaloacetic transaminase; GPT = glutamic pyruvate transaminase; CHO = cholesterol.

