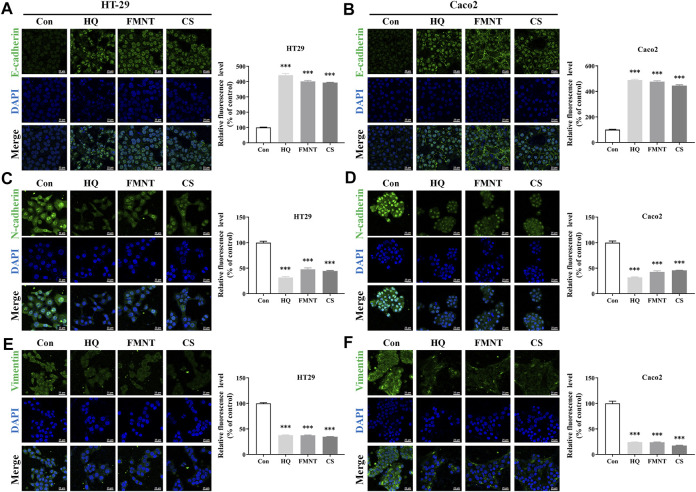
FIGURE 10.
HQ, FMNT and CS significantly increased the fluorescence intensity of E-cadherin (A, B), and decreased the fluorescence intensity of N-cadherin (C, D) and Vimentin (E, F) in HT29 and Caco2 cells. The fluorescence intensity of E-cadherin, N-cadherin, and Vimentin in HT29 and Caco2 cells were detected after treatment with HQ (100 mg/mL, 48 h), FMNT (100 μM, 48 h) or CS (100 μM, 48 h), respectively. The data represent the mean ± SD (n = 3). *** p < 0.001 compared with the control group.

