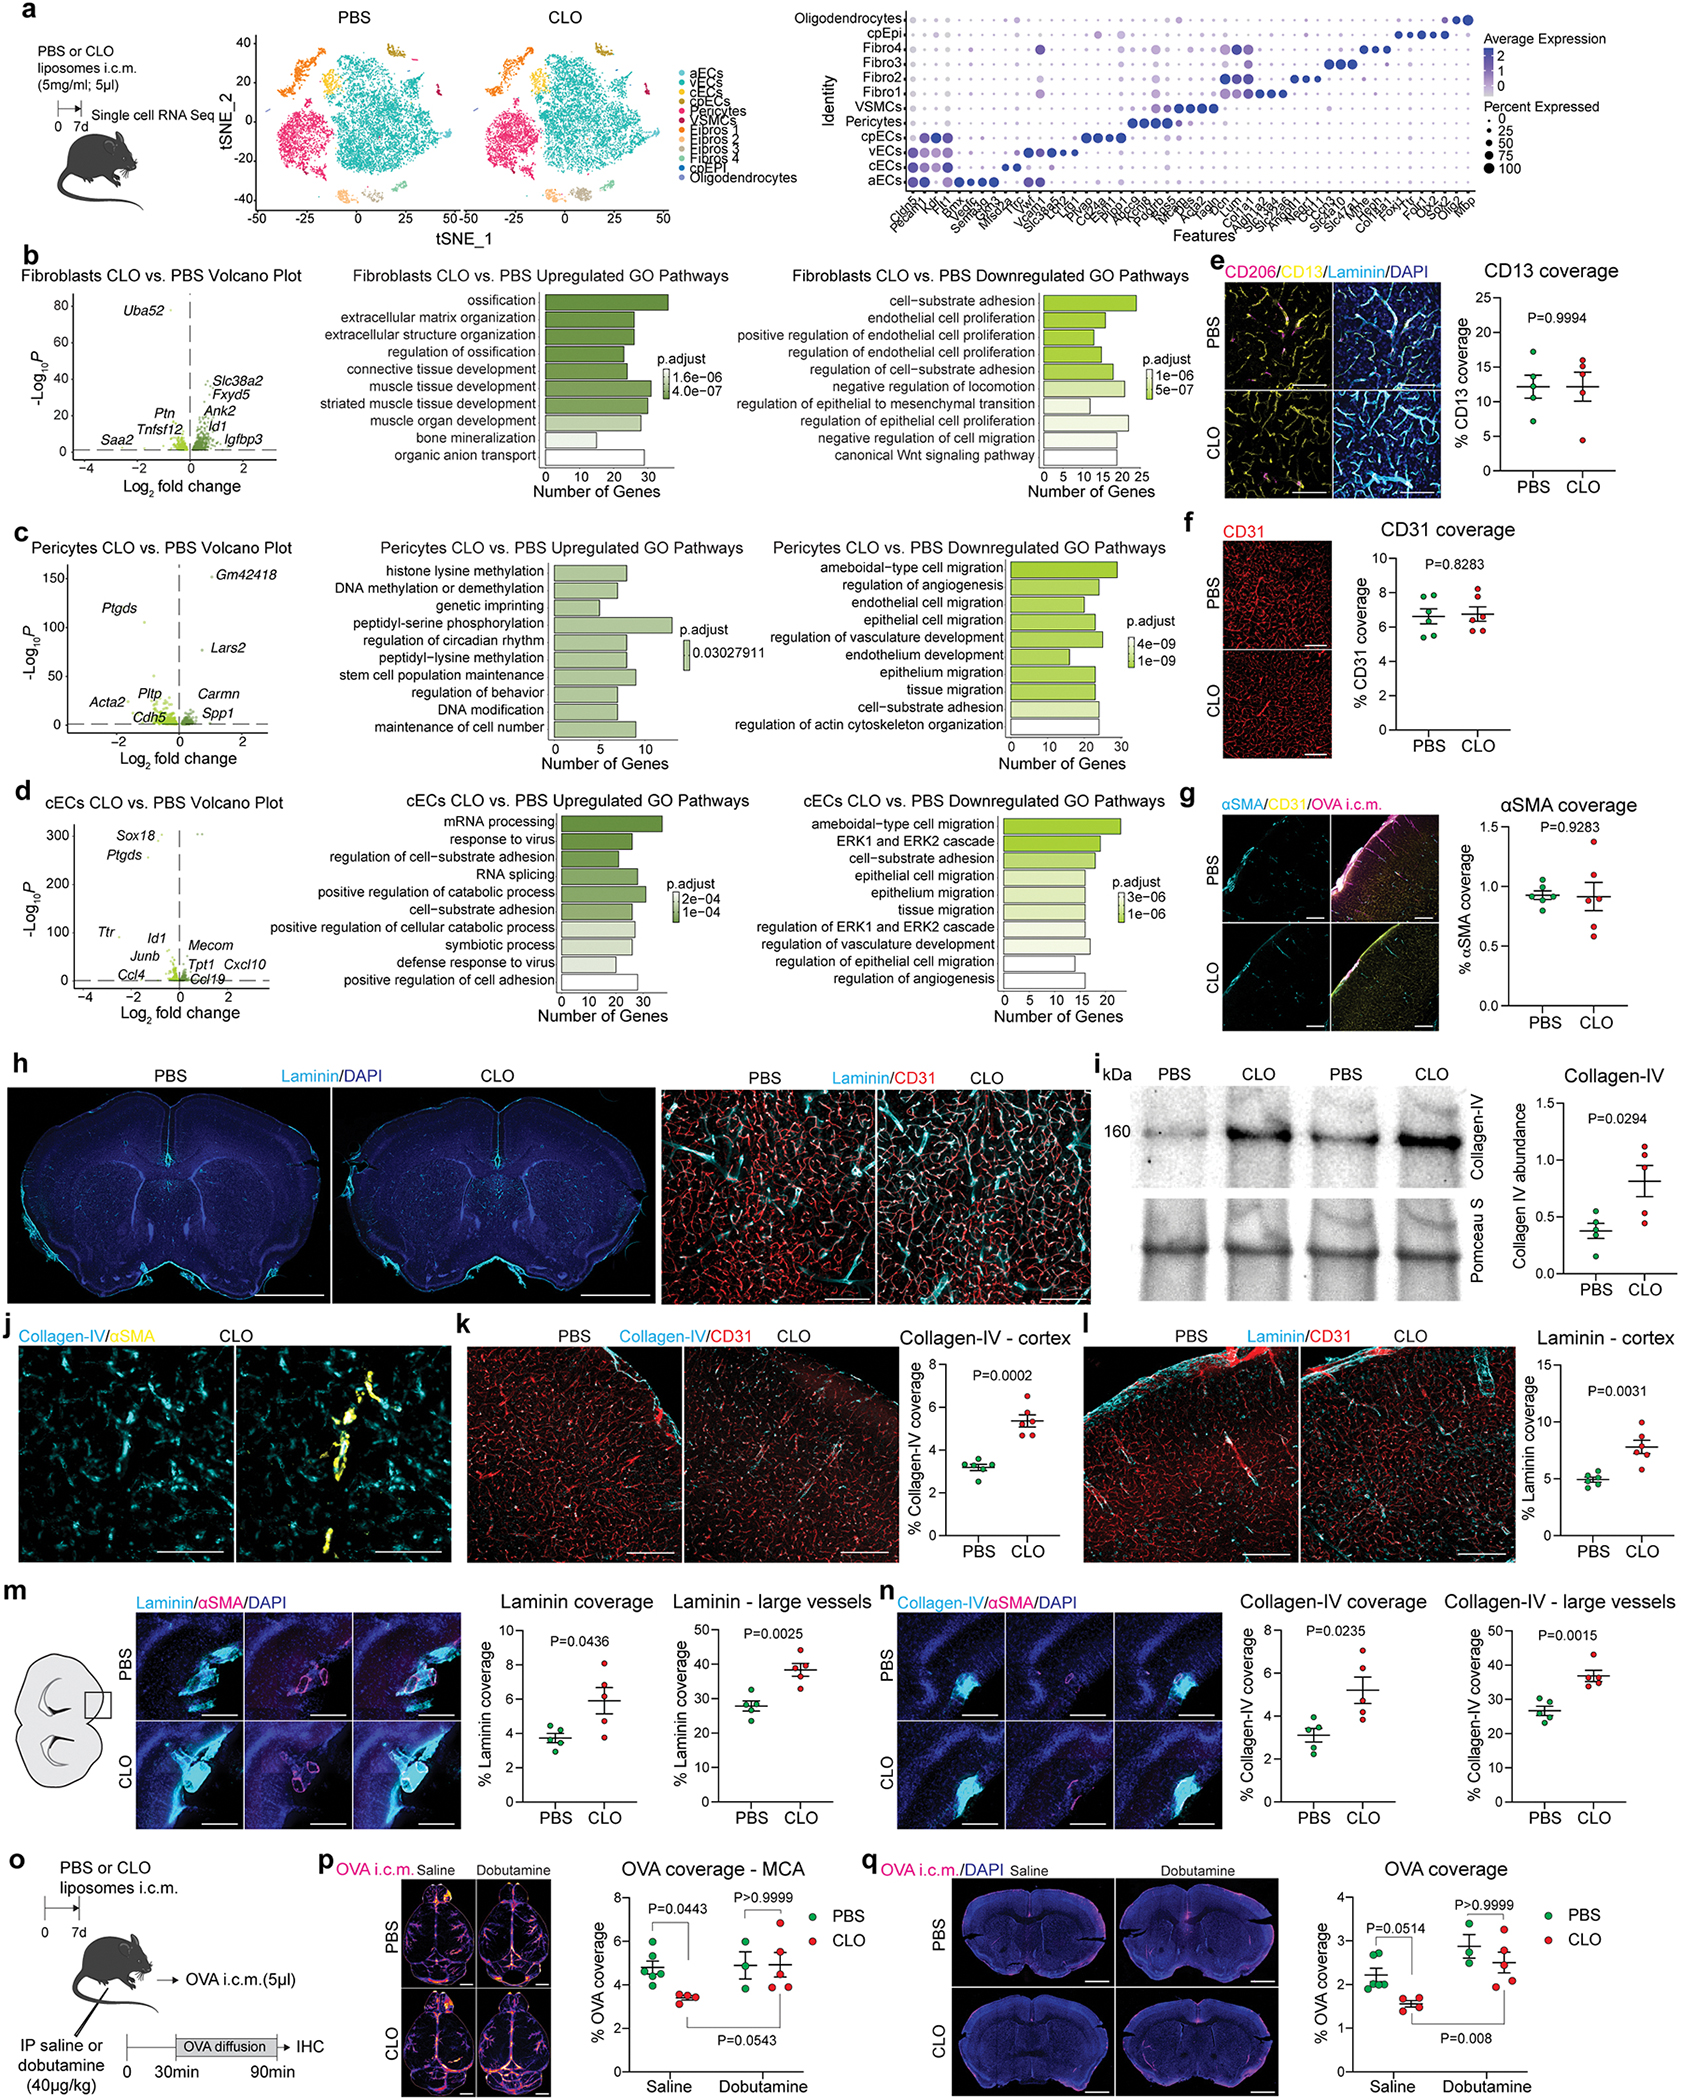
Extended Data Fig 6. PBMs and extracellular matrix remodeling.

a, One week after CLO or PBS liposome injection, mice were perfused, brains were extracted, lateral choroid plexuses were removed, CD45-CD13+ and CD45-CD31+ cells were sorted and used for single-cell RNA sequencing. Nine different cell types were identified based on canonical markers. b, Volcano plot corresponding to up- and down-regulated genes comparing fibroblasts in PBM-depleted mice and PBS-treated control mice, and corresponding GO Pathway analyses showing up- (left) and down-regulated (right) pathways. c, Volcano plot corresponding to up- and down-regulated genes comparing pericytes in PBM-depleted mice and PBS-treated control mice, and corresponding GO Pathway analyses showing up- (left) and down-regulated (right) pathways. d, Volcano plot corresponding to up- and down-regulated genes comparing capillary endothelial cells (cECs) in PBM-depleted mice and PBS-treated control mice, and corresponding GO Pathway analyses showing up- (left) and down-regulated (right) pathways. For b-d, Volcano plots: F-test with adjusted degrees of freedom based on weights calculated per gene with a zero-inflation model and Benjamini-Hochberg adjusted P values; GO-pathways analyses: over-representation test. e, Representative images showing cortical brain sections stained for anti-CD13 (mural cells, yellow) co-stained for anti-CD206 (magenta), anti-Laminin (cyan) and DAPI, and corresponding quantification. Scale bar, 100μm; n = 5 mice/group; two-tailed unpaired Welch’s t-test. f, Representative images showing cortical brain sections stained for anti-CD31 (endothelial cells) and corresponding quantification. Scale bar, 200μm; n = 6 mice/group; two-tailed unpaired Welch’s t-test. g, Representative images showing cortical brain sections of mice that were i.c.m. injected with OVA (magenta), stained for anti-αSMA (vascular smooth muscle cells, cyan) and co-stained for anti-CD31 (yellow), and corresponding quantification. Scale bar, 200μm; n = 6 mice/group; two-tailed unpaired Welch’s t-test. h, One week after CLO or PBS liposome injection, brain coronal sections were stained for anti-Laminin (cyan) and DAPI (blue). Scale bar, 2mm. k, High magnification images showing Laminin (cyan) in association with CD31+ blood vessels (red). Scale bar, 200μm. i, Representative Western blot images of Collagen-IV (160kDa) and Ponceau S from isolated brain blood vessels one week after PBM depletion, and corresponding quantification. n = 5 mice/group; two-tailed unpaired Welch’s t-test. j, Representative images showing Collagen-IV (cyan) deposition at both αSMA+ (arteries/arterioles; yellow) and αSMA− blood vessels. Scale bar, 200μm. k and l, Representative images from mouse cortex showing accumulation of k: Collagen-IV; and l: Laminin (cyan), co-stained for anti-CD31 (red), and respective quantifications. Scale bars, 200μm; n = 6 mice/group; two-tailed unpaired Welch’s t-test. m, High magnification images showing Laminin (cyan) in association with αSMA+ surface and penetrating large blood vessels (magenta), and corresponding quantifications. n, High magnification images showing Collagen-IV (cyan) in association with αSMA+ surface and penetrating large blood vessels (magenta), and corresponding quantifications. For m and n: Scale bar, 200μm; n = 5 mice/group; two-tailed unpaired Welch’s t-test. o, Experimental schematic: mice received an i.p. injection of dobutamine (40μg/kg) or saline 30min prior to receiving an i.c.m. injection of OVA (1mg/ml; 5μl). Mice were perfused one hour later. p, Representative images showing OVA distribution in whole brains and corresponding quantifications. q, Representative images showing OVA coverage on brain coronal sections and corresponding quantifications. For p and q, Scale bars, 2mm; n = 6 mice treated with PBS, 4 mice treated with CLO in saline group; 3 mice treated with PBS, and 5 mice treated with CLO in dobutamine group; two-way ANOVA with multiple comparisons. All data are presented as mean values +/− SEM.
