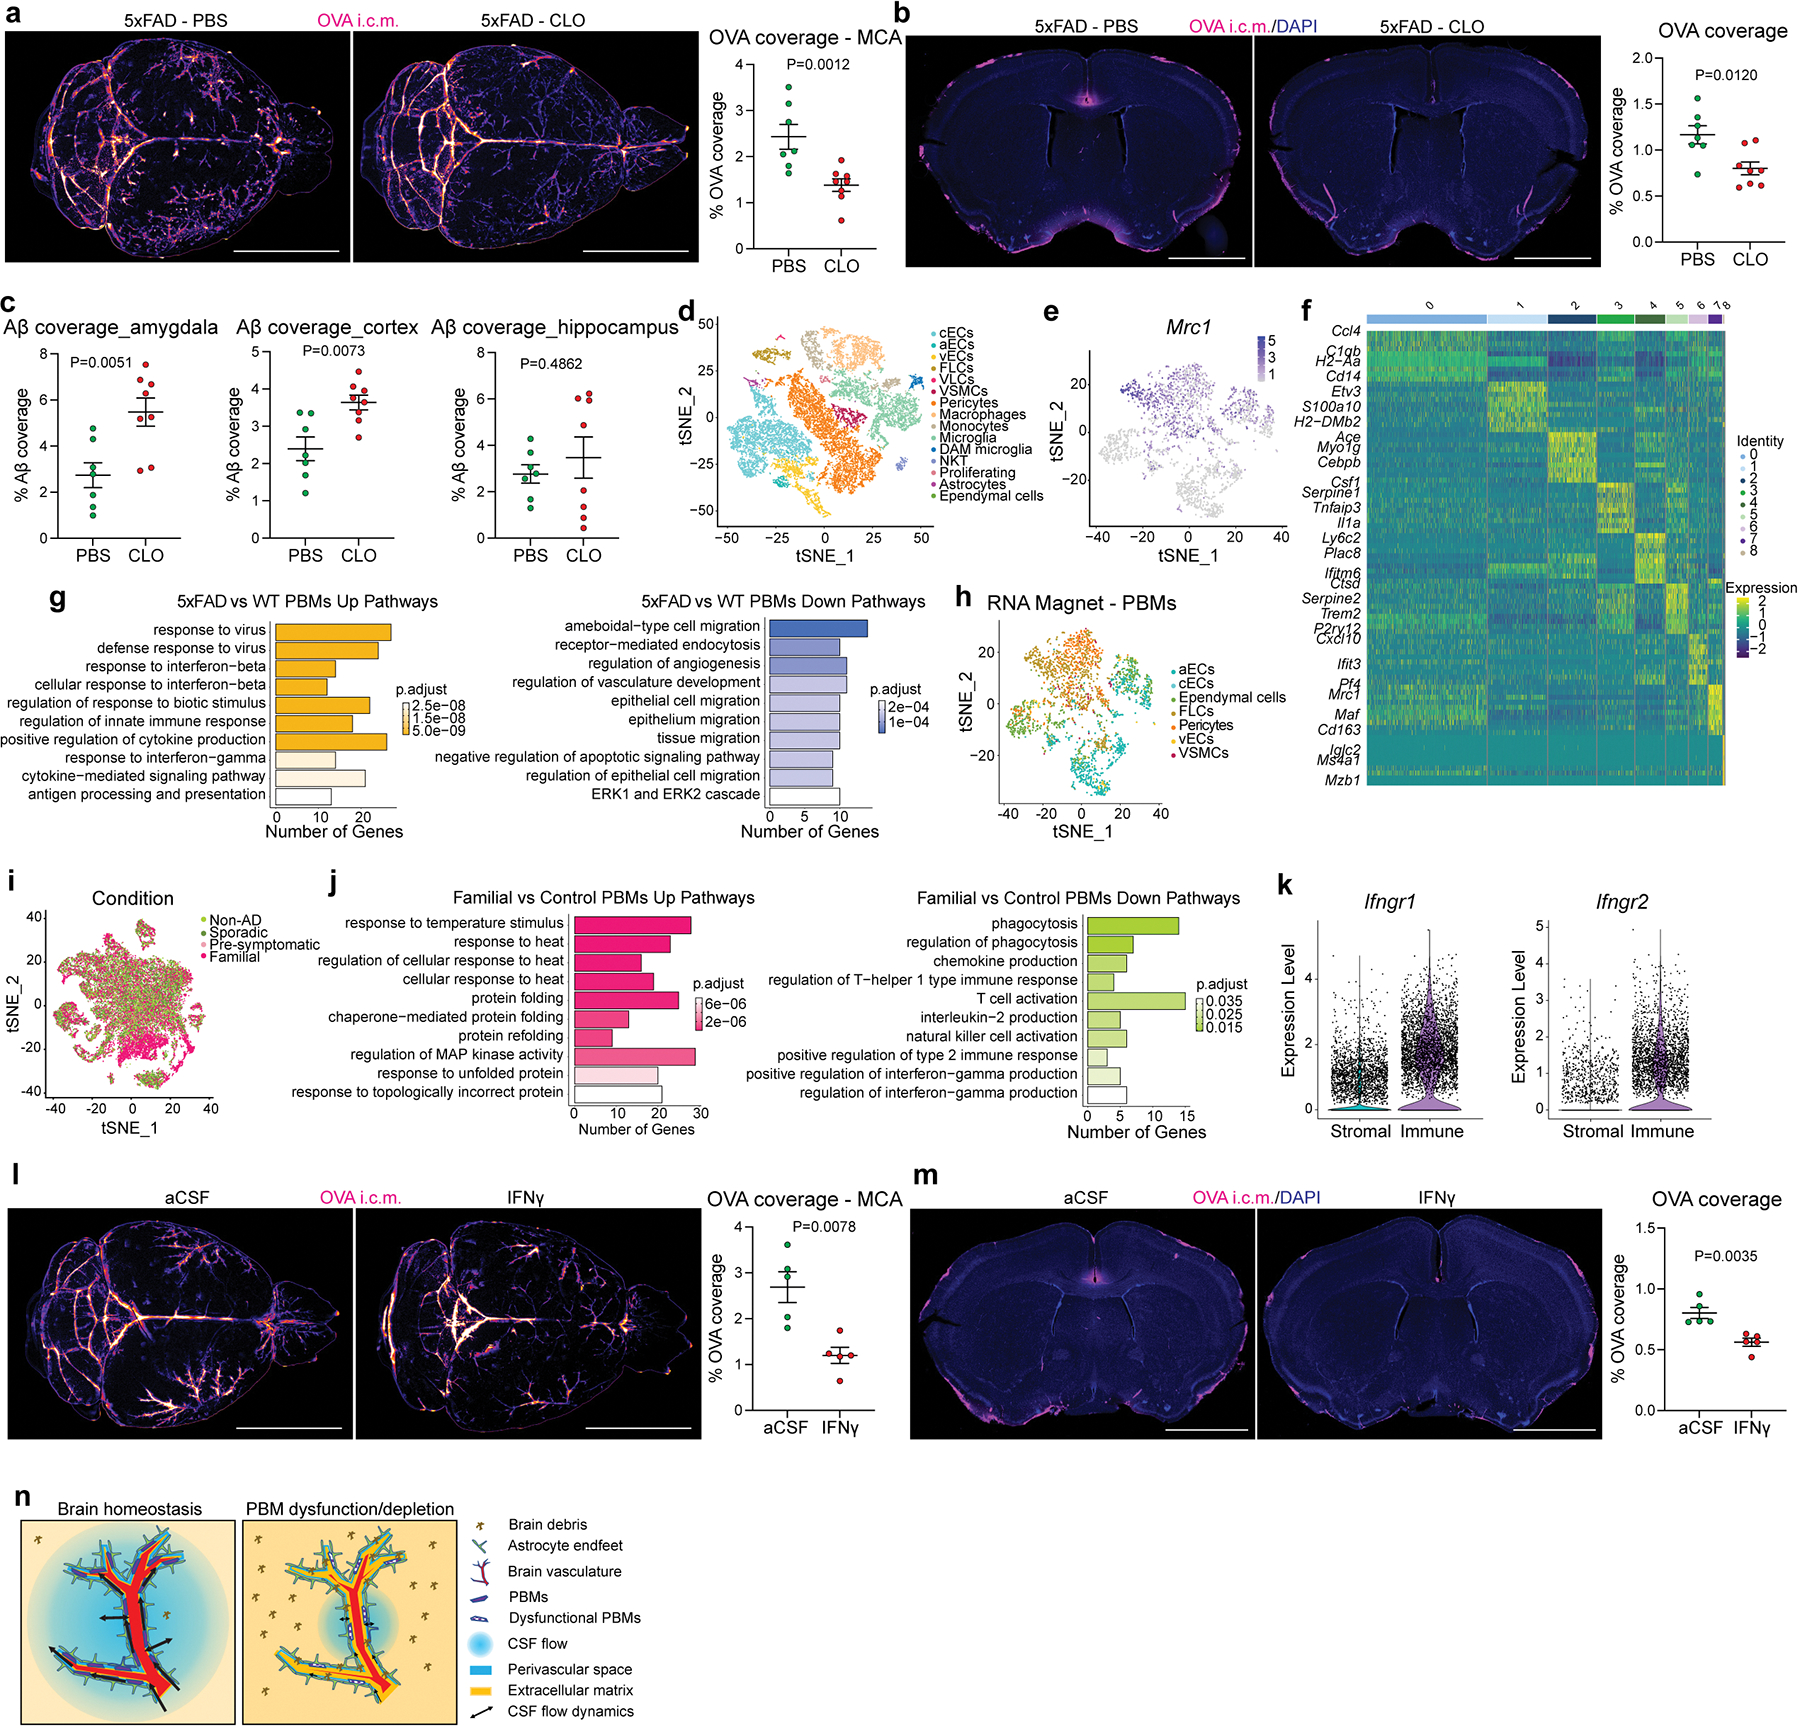
Extended Data Fig 10. PBMs in an Alzheimer’s disease mouse model and in AD patients.

a and b, One month after CLO or PBS liposome injection, 5xFAD mice received an i.c.m. injection of OVA, and brains were analyzed one hour later. a, Representative images and quantification of OVA distribution in whole brains. Scale bar, 2mm. b, Representative images and quantification of OVA coverage on brain coronal sections. Scale bar, 2mm. For a and b, n = 7 5XFAD mice treated with PBS, and 8 5XFAD mice treated with CLO; two-tailed unpaired Welch’s t-test. c, Quantification of Aβ coverage in amygdala, cortex and hippocampus. n = 7 5XFAD mice treated with PBS, and 8 5XFAD mice treated with CLO; two-tailed unpaired Welch’s t-test. d, tSNE plot showing 35 different clusters on the 5xFAD mouse single-cell RNA sequencing dataset, based on expression of CD13, CD31 and CD45. e, Mrc1 expression in macrophage cluster allows PBM identification. f, Heatmap showing top 10 positively differentially expressed genes per cluster by adjusted p-value. g, GO Pathway analysis showing up- and down-regulated pathways in 5xFAD mice compared to their WT littermates. Over-representation test. h, The RNA Magnet algorithm determined that PBMs interact preferentially with vascular smooth muscle cells (VSMCs), pericytes and fibroblast-like cells (FLCs). i, Single-nuclei RNA sequencing on familial, pre-symptomatic, sporadic and non-AD patients. j, GO Pathway analysis showing up- and down-regulated pathways in familial AD patients compared to controls. Over-representation test. k, Gene expression levels of Ifngr1 and Ifngr2 from immune versus stromal cells from the mouse 5xFAD single-cell RNA sequencing dataset. l and m, Wild-type mice received an i.c.m. injection of artificial CSF (aCSF) or interferon gamma (IFNγ, 20ng/ml; 1μl). The same mice received an i.c.m. injection of OVA (1mg/ml; 5μl) 3 hours later and brains were harvested one hour later. l, Representative images and quantification of OVA distribution in whole brains. m, Representative images showing OVA coverage on brain coronal sections and corresponding quantification. For l and m, n = 5 mice/group; two-tailed unpaired Welch’s t-test. n, Proposed model that recapitulates the findings. All data are presented as mean values +/− SEM.
