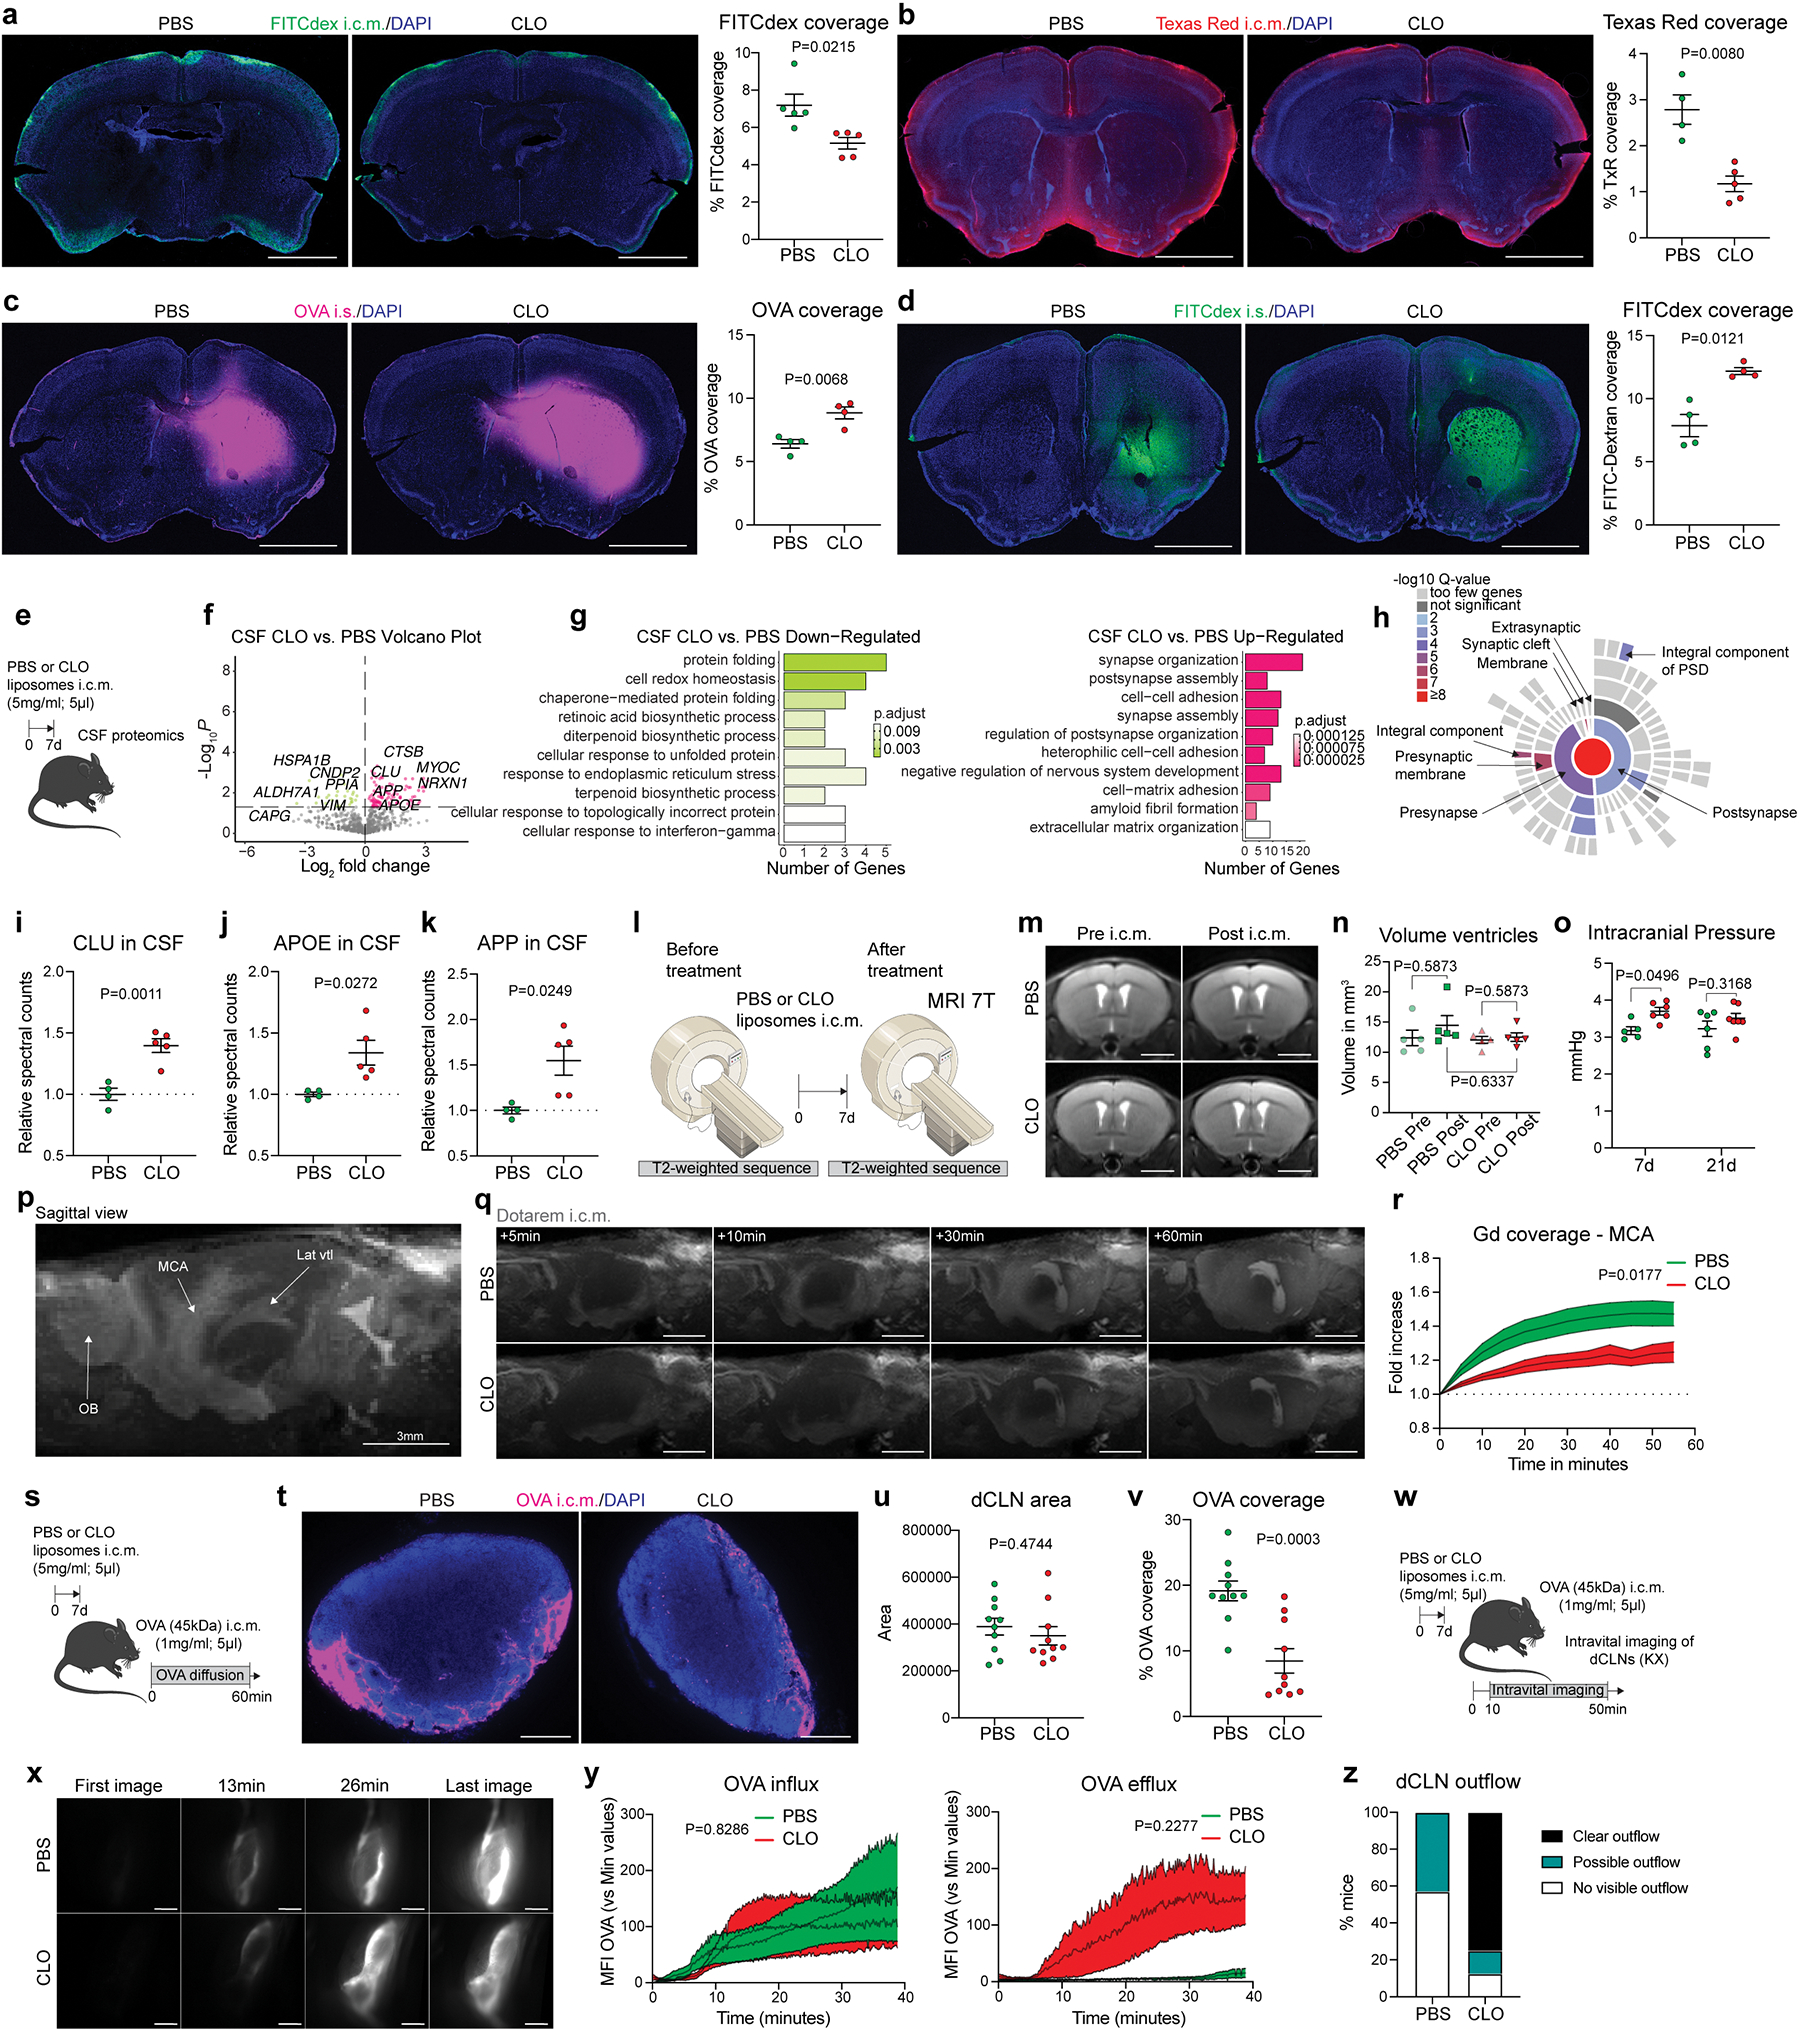
Extended Data Fig 3. CSF flow after PBM depletion.

a, One week after PBM depletion, mice received an i.c.m. injection of FITC-Dextran (FITCDex; 4kDa; 5μl), brains were harvested one hour later and FITCDex (green) coverage was measured on coronal sections co-stained for DAPI. Representative images and corresponding quantifications are shown. Scale bar, 2mm. n = 5 mice/group; two-tailed unpaired Welch’s t-test. b, One week after PBM depletion, mice received an i.c.m. injection of Texas Red (3kDa; 5μl), brains were harvested one hour later and Texas Red (red) coverage was measured on coronal sections co-stained for DAPI. Representative images and corresponding quantifications are shown. Scale bar, 2mm. n = 4 mice treated with PBS, and 5 mice treated with CLO; two-tailed unpaired Welch’s t-test. c, One week after PBM depletion, mice received an intrastriatal injection of OVA (45kDa; 1μl) and brains were harvested one hour later. Representative images and corresponding quantifications are shown. Scale bar, 2mm. n = 4 mice treated with PBS, and 5 mice treated with CLO; two-tailed unpaired Welch’s t-test. d, One week after PBM depletion, mice received an intrastriatal (i.s.) injection of FITC-Dextran (FITCdex; 4kDa; 1μl) and brains were harvested one hour later. Representative images and corresponding quantifications are shown. Scale bar, 2mm. n = 4 mice/group; Two-tailed unpaired Welch’s t-test. e, One week after CLO or PBS liposome injection, mice were anesthetized, and a glass capillary was inserted i.c.m. to collect CSF for proteomic analyses. f, Volcano plot corresponding to down- and up-regulated proteins in CSF comparing PBM-depleted and control mice. F-test with adjusted degrees of freedom based on weights calculated per gene with a zero-inflation model and Benjamini-Hochberg adjusted P values. g, Corresponding GO Pathway analysis showing down- and up-regulated pathways in PBM-depleted and control mice. Over-representation test. h, Sunburst plot representing the location of the upregulated CSF-derived neuronal/synaptic-related proteins after PBM depletion. i-k, Quantification of relative spectral counts for i, Clusterin (CLU); j, Apolipoprotein E (APOE) and k, Amyloid Precursor Peptide (APP). For e-k: n = 4 mice treated with PBS, and 5 mice treated with CLO; two-tailed unpaired Welch’s t-test. l, MRI based T2-weighted anatomical sequences were performed before and one week after PBM depletion. m, Representative T2 images showing lateral ventricles (in hypersignal) before and after PBM depletion. Scale bar, 2mm. n, Quantification of ventricle volume in mm3. n = 5 mice/group; one-way ANOVA with Tukey multiple comparisons test. o, Intracranial pressure was measured one- (7d) and three (21d) weeks after PBM depletion. n = 5 mice treated with PBS, 7 mice treated with CLO at 7d; 6 mice treated with PBS, and 7 mice treated with CLO at 21d; two-way ANOVA with Sidak’s multiple comparisons test. p, Sagittal view of a T1-FLASH 3D image showing Dotarem (0.754kDa; 5μl) accumulation in different brain compartments, including the olfactory bulbs (OB), the lateral ventricles (Lat vtl) and the middle cerebral artery (MCA). Scale bar, 3mm. q, Representative T1-FLASH 3D images showing Dotarem distribution at the MCA level over time. Scale bar, 3mm. r, Quantification of Dotarem signal fold increase over an hour. n = 5 mice treated with PBS, and 7mice treated with CLO; repeated measures 2-way ANOVA with Geisser-Greenhouse correction. s, One week after CLO or PBS liposome injection, mice received an i.c.m. injection of OVA, and deep cervical lymph nodes (dCLNs) were harvested one hour later. t, Representative images showing OVA coverage on dCLN sections. Scale bar, 200μm. u, Quantification of dCLN area. v, Quantification of OVA coverage. For u and v: n = 10 mice/group; two-tailed unpaired Welch’s t-test. w, One week after CLO or PBS liposome injection, mice received an i.c.m. injection of OVA and then placed in supine position under the stereomicroscope for dynamic imaging of OVA diffusion in the exposed lymph nodes. x, Representative images showing OVA coverage in dCLNs over time. Scale bar, 500μm. y, Quantifications of both OVA influx (left) and efflux (right) over time. n = 3 mice treated with PBS, and 7 mice treated with CLO; repeated measures 2-way ANOVA with Geisser-Greenhouse correction. z, Proportion of mice that showed OVA outflow from dCLNs. All data are presented as mean values +/− SEM.
