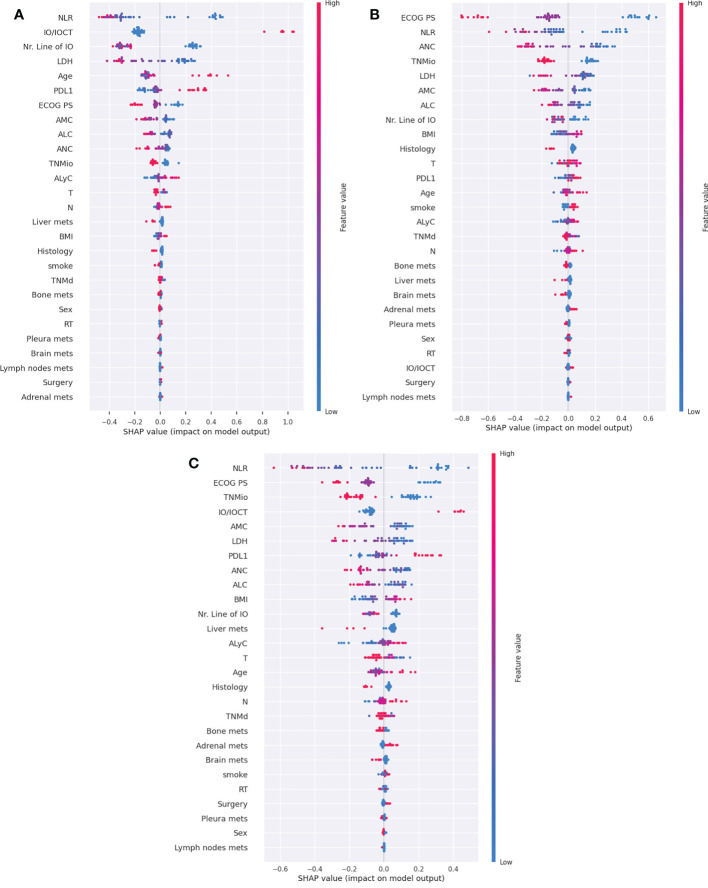
Figure 5.
SHAP summary plots for the CB model for three main outcomes: DCR (A), OS6 (B) and TTF3 (C). IO/IOCT, immuno-oncologic treatment/immuno-oncologic and chemotherapy treatment; PDL-1, programmed death ligand-1; ECOG PS, eastern cooperative oncology group performance status; NLR, Neutrophil-to-lymphocyte ratio; AMC, absolute monocytes count; ALC, absolute leucocytes count; ANC, absolute neutrophils count; ALyC, absolute lymphocytes count; TNMd, TNM staging at diagnosis; TNMio, TNM staging at baseline of IO; BMI, body mass index; RT, radiotherapy.

