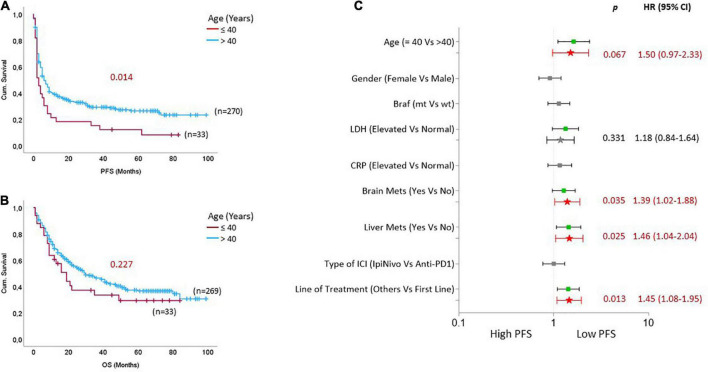
FIGURE 1.
Rapid disease progression on immune checkpoint inhibitors (ICIs) in young patients with stage IV cutaneous melanoma. Kaplan Meier curves based on age groups for (A) progression-free survival and (B) overall survival. (C) The forest plot indicates univariate (box symbol) and multivariate regression (star symbol) analysis for PFS of ICI-treated mCM patients. The green color in the plot indicates that this clinical feature is a high-risk factor for PFS in univariate analysis, and the bright red indicates a high-risk factor in the multivariate model. P-values from the multivariate analysis are presented on the graph.

