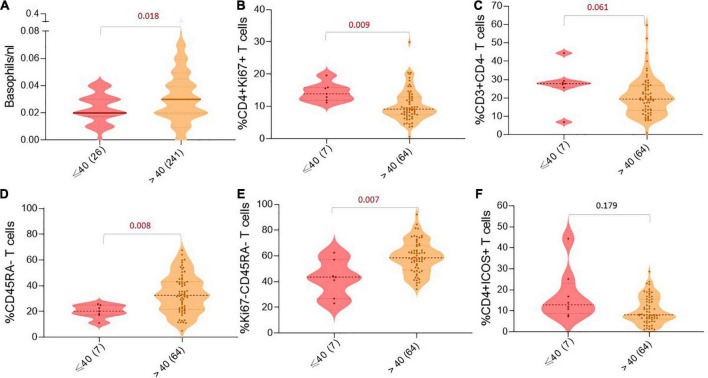
FIGURE 2.
Age-dependent differences in peripheral immune cell populations. Violin charts showing the number/frequency of immune cells in the patient’s blood based on age groups: (A) Basophils/nl, (B) %CD4 + Ki67 + T cells, (C) %CD3 + CD4-T cells, (D) %CD45RA-T cells, (E) %Ki67-CD45RA-T cells, and (F) %CD4 + ICOS + T cells. For all charts, the thick horizontal line and the thin dotted lines represent the 95% CI, respectively. The width of the curved shape indicates the proportion of patients in the group. P-values are presented above the respective immune cell subset.

