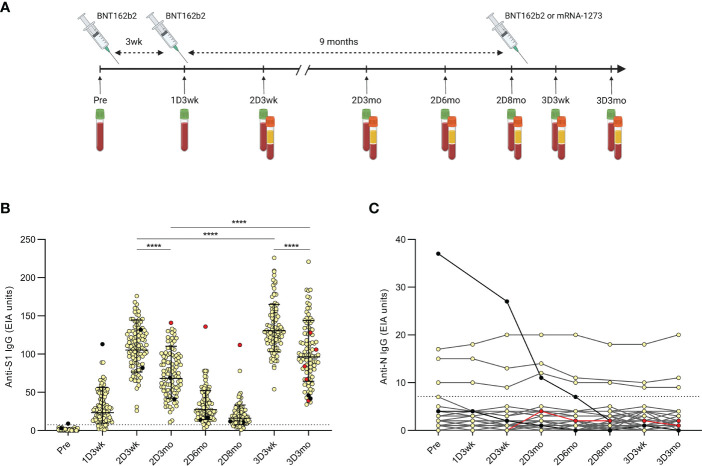
Figure 1.
Timeline of the COVID-19 vaccinations and samplings of the HCWs and antibody levels after the second and third COVID-19 mRNA vaccine doses. (A), Serum samples and peripheral blood mononuclear cells (PBMCs) were collected at regular intervals from health care workers (HCWs, n=100) vaccinated with two sequential doses of BNT162b2 (BioNTech-Pfizer) and a third mRNA vaccine dose of either BNT162b2 (n=46) or mRNA-1273 (Moderna; n=54). Sera were collected before the first vaccination and up to three months after the third dose and PBMCs were collected from a proportion of the HCWs (n=32) at indicated time points. (B), SARS-CoV-2 S1-specific IgG antibody levels were measured with EIA from the serum samples collected before the first vaccination (Pre; n=100), three weeks after the first vaccination (1D3wk; n=99), three weeks (2D3wk; n=100), three months (2D3mo; n=99), six months (2D6mo; n=100), and eight months (2D8mo; n=85) after the second vaccine dose, and three weeks (3D3wk; n=100) and three months (3D3mo; n=94) after the third vaccine dose. Geometric means with geometric SDs are shown. Wilcoxon signed-rank test was used to analyze the statistical significance between time points (2D3wk vs 2D3mo; 2D3wk vs 3D3wk; 3D3wk vs 3D3mo; 2D3mo vs 3D3mo), and two-tailed p-values <0.05 were considered statistically significant. ****p<0.0001. (C), SARS-CoV-2 N-specific IgG antibody levels were measured with EIA from the same samples as the S1-specific IgG antibodies. Black dots represent HCWs with a PCR-confirmed SARS-CoV-2 infection prior to the first vaccination (n=2) and red dots represent HCWs with a breakthrough infection after the second vaccine dose (n=1) or after the third vaccine dose (n=4). Cut-off values are indicated with dashed lines.

