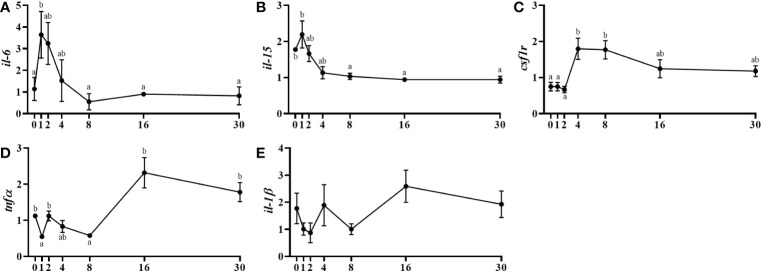
Figure 5.
Relative gene expression of the inflammatory markers, il-6 (A), il-15 (B), csf1r (C), tnfα (D), il-1β (E) in injured epaxial muscle of fish. Data are shown as means ± SEM, n=10. Statistical analysis was assessed by one-way ANOVA. Different letters indicate significant differences of factor time (days post-injury) (Tukey’s HSD or Games-Howell post-hoc test, p < 0.05).

