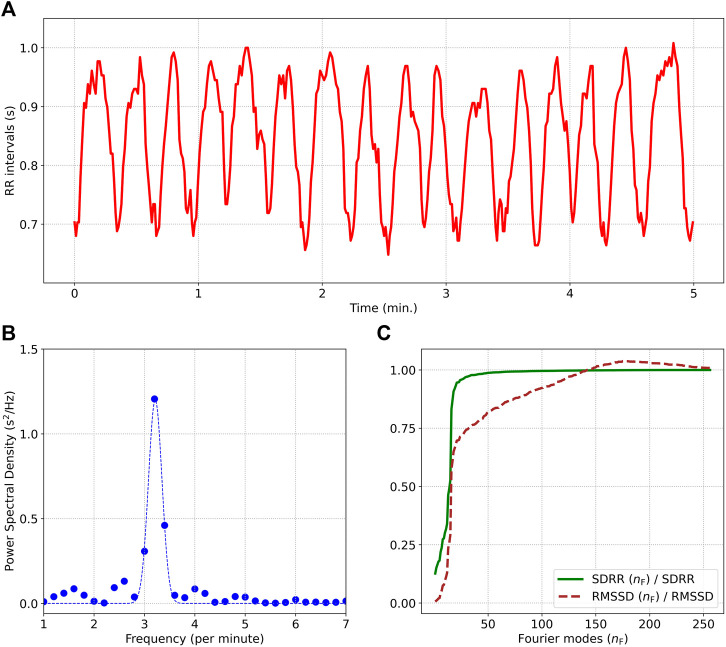
FIGURE 1.
(A) describes a 5 min segment of the RR interval time series, from a subject practicing Chi meditation. (B) Shows the power spectral density showing strong respiratory sinus arrhythmia at a respiratory frequency of 3.2 min−1. The ratios (RMSSD (n F)/RMSSD) and (SDRR (n F)/SDRR) computed from the first n F Fourier modes are displayed in (C). Many more Fourier modes need to be included for the computation of RMSSD (n F) compared to SDRR (n F) since RMSSD preferentially weights the higher frequency modes.

