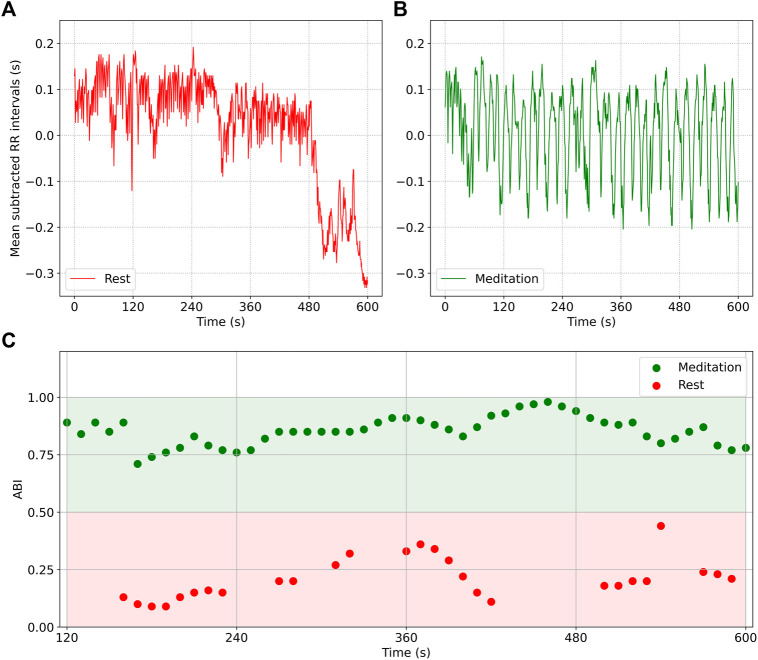
FIGURE 4.
RR interval data (mean subtracted) from a participant at rest (A) and during Chi meditation (B). RSA is noticeably present in both plots, but is dominant in (B). Plot (C) shows the ABI computed from 2 min of data. The red data points are plotted for the waveform in (A), while the green data points are plotted for the waveform in (B). The ABI = .5 line is an approximate boundary that separates focused meditation from other activities.

