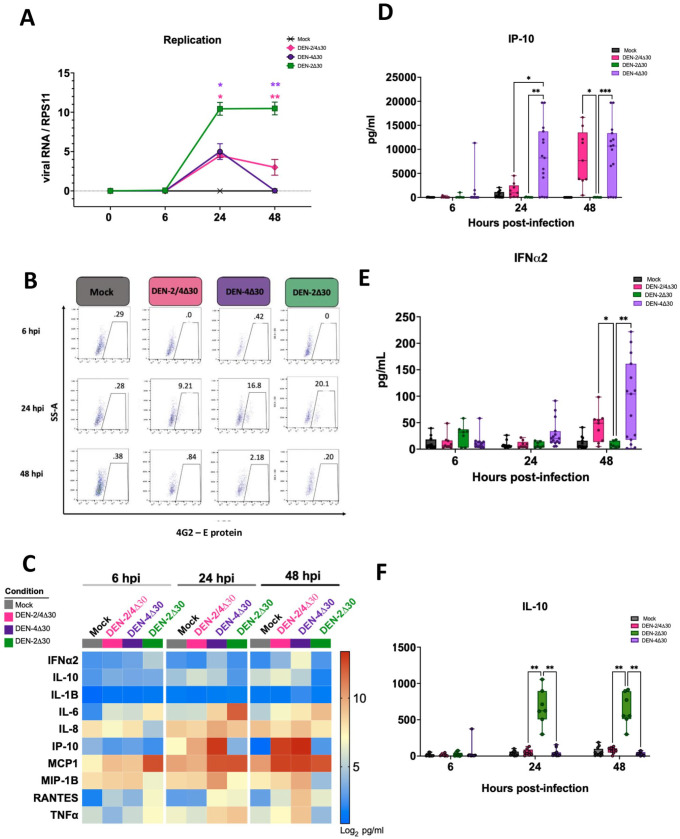
Figure 3.
DENV-2 vaccine and DENV-4 vaccine viruses induce robust levels of IP-10 and IFNα2 but the DENV-2 challenge strain does not. (A) Viral replication was quantified via real-time quantitative PCR (RT-qPCR) using the previously described 3' untranslated region (UTR) primer. Monocyte-derived dendritic cells (MDDCs) were infected at 0 (1 h after infection), 6, 24, and 48 hpi. Viral RNA was quantified as previously described. (B) MDDCs were infected with either Mock, rDEN-2/4Δ30, rDEN-4Δ30 vaccine, or rDEN-2Δ30 challenge strains and cells were stained by flow cytometry (Data shown from one representative donor). The percentages of infected cells were quantified by measuring E protein levels at 6, 24, and 48 hpi. (C) Heat map comparing specific cytokine production levels by MDDCs after mock, trivalent, tetravalent, or DEN-4Δ30 × 2 infection. Calculations were made using data acquired from 10-plex ELISA. The cytokine levels were calculated as the log2 values obtained in pg/mL (nine DC donors are represented. Red indicates greater expression levels. (D to F) Data are reflective of values represented in panel B. Black asterisks represent statistical significance by the two-way analysis of variance (ANOVA), with adjustment for multiple comparisons and the Bonferroni correction (*P ⩽ 0.05, **P ⩽ 0.01, **P ⩽ 0.001). (A color version of this figure is available in the online journal.)

