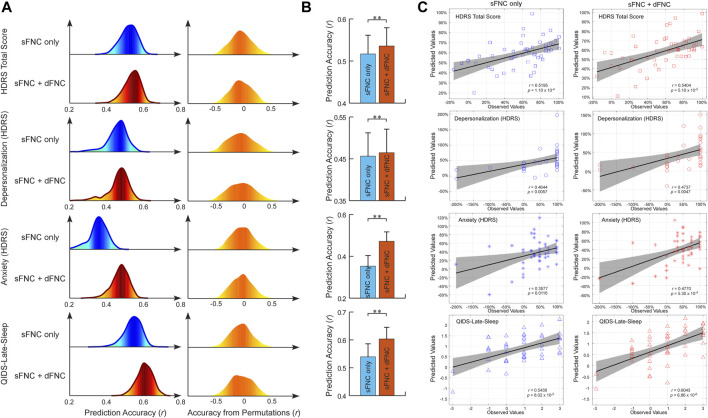
FIGURE 2.
FNC-based prediction results for antidepressant outcomes induced by ECT. (A) Distribution of prediction accuracies across 1,000 repetitions of cross-validation and distribution of accuracies based on permutation testing across 1,000 iterations. (B) Statistical analysis between prediction accuracies based on sFNC features only and based on combined features (sFNC+dFNC). (C) Scatter plot shows prediction of changes in HDRS24 scores and QIDS score. Considering that the prediction framework was repeated 1,000 times, we only show results from the iteration with the median prediction accuracy.

