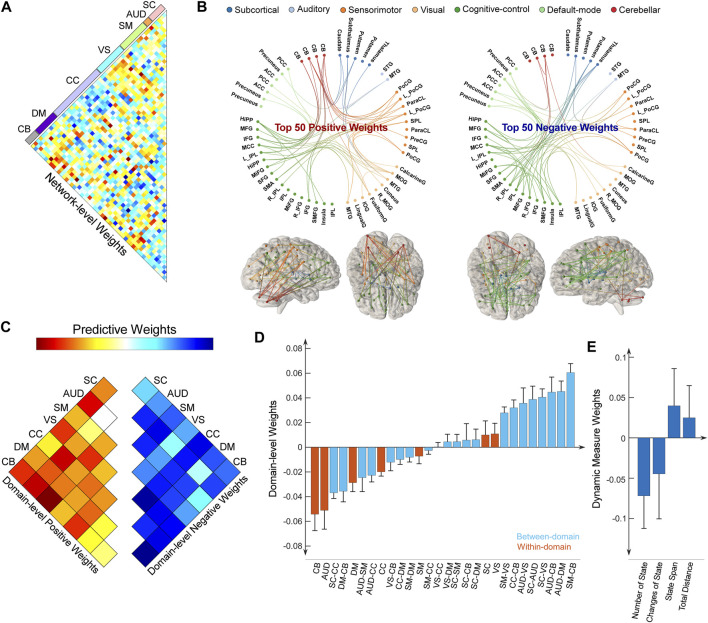
FIGURE 5.
Distributions of weight maps in predicting cognitive changes (HVLT-DR score). (A) Distributions of raw predictive weights at the FNC pair level averaged across 10,000 CV rounds. (B) Functional connectome plots with the top 50 positive weights and top 50 negative weights. ICNs are arranged into seven functional domains with different colors. (C) The cell plots show the domain-level representation of the predictive weights. For each pair of domains (between-domain and within-domain), we averaged predictive weights of all sFNC belonging to that domain pair. Positive weights and negative weights were separately summarized for each domain pair to demonstrate their relative contribution. (D) Mean weights distribution of within-domain and between-domain sFNC in the predictive models. Error bars indicate standard deviation. (E) Mean weights distribution of dFNC features in the predictive models.

