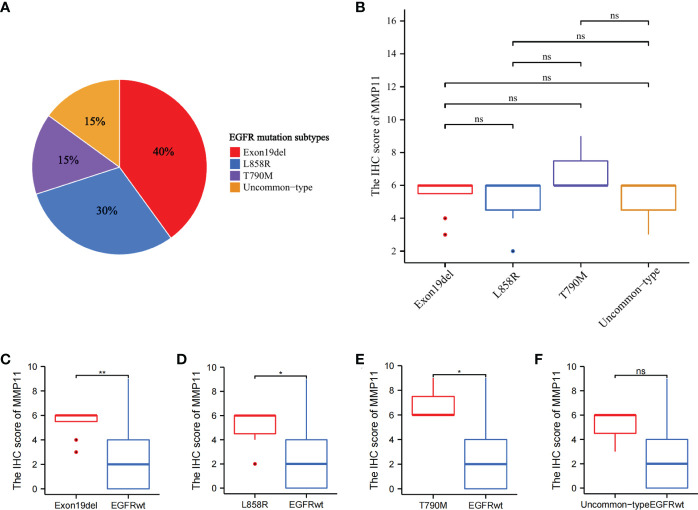
Figure 3.
Differential expression of MMP11 between different EGFR mutation subtypes at the level of IHC scores. (A) Proportion of EGFR-mutant samples by mutation subtypes among 20 EGFR-mutant LUAD clinical samples, the Exon19del group is red, the L858R group is blue, the T790M group is purple, the uncommon-type group is yellow (pie chart); (B) The differences in MMP11 ICH scores between the Exon19del group (red), the L858R group (blue), the T790M group (purple), the uncommon-type group (yellow); (C) Differences in MMP11 IHC scores between the Exon19del and EGFR-wild groups; (D) Differences in MMP11 IHC scores between the L858R and EGFR-wild groups; (E) Differences in MMP11 IHC scores between the T790M and EGFR-wild groups; (F) Differences in MMP11 IHC scores between the uncommon-type group and EGFR-wild groups; *P < 0.05; **P < 0.01; ns, no statistical significance.

