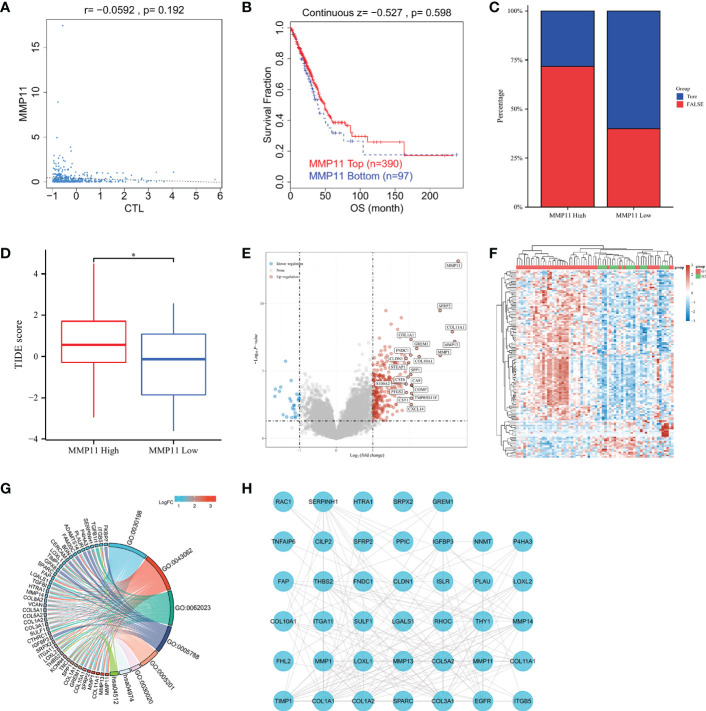
Figure 4.
Relationship between MMP11 and immune response. (A) Correlation of MMP11 with cytotoxic T-cell level in TCGA-LUAD (TIDE); (B) Kaplan-Meier curves of survival ratios as a measure of the immunotherapeutic response (immune checkpoint blockade) between groups with high and those with low expression levels of MMP11 in TCGA-LUAD (TIDE); (C) Proportions of samples in EGFR mutant lung adenocarcinoma MMP11 high and low expression groups (histogram, TCGA); (D) Difference in TIDE scores between the high MMP11 expression group (red) and low expression group (blue) in EGFR-mutant LUAD (TCGA), *P < 0.05; (E) Differential gene analysis of EGFR-mutant LUAD MMP11 high and low expression groups; blue indicates downregulation; and red indicates upregulation; (F) Correlation heatamap of 50 upregulated genes and 50 downregulated genes; red indicates upregulation; blue indicates downregulation; the darker the color, the higher the correlation; (G) Functional enrichment analysis of the top 100 genes with the most significantly different trends of alteration; KEGG and GO; (H) PPIs of the 50 genes with the most significant differences in the EGFR mutant lung adenocarcinoma MMP11 high and low expression groups and EGFR.

