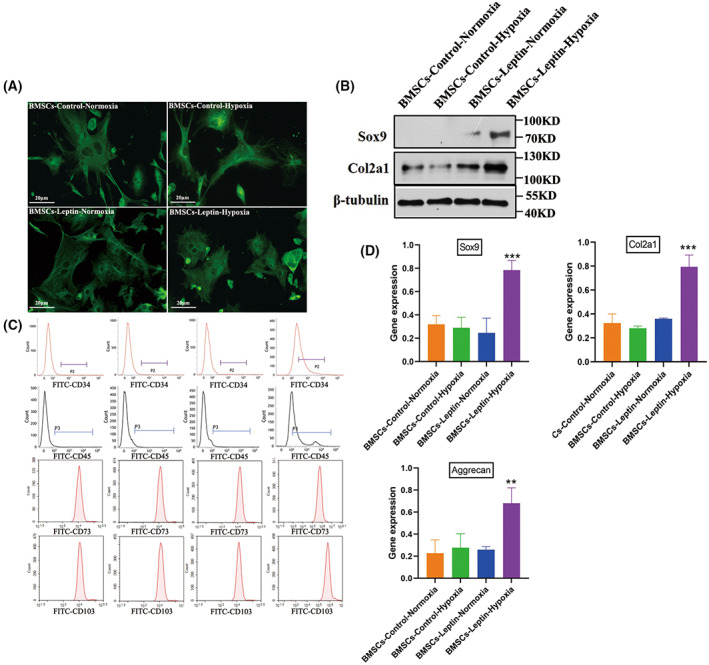
Fig. 1.

Morphology and characterization of bone marrow mesenchymal stem cells (BMSCs) in vitro culture. (A) α‐tubulin stained BMSCs, which were isolated from 8‐week‐old male mice. (B) Western blot analysis of Sox9 and Col2a1 in articular chondrocytes. (C) Flowcytometry analysis of the BMSCs surface markers are CD73 and CD105. (D) Gene expression analysis of Col2a1, aggrecan, and Sox9 in four groups. The expression level in the treatment group was significantly higher than in the degeneration group. Representative microscope images are magnified 400× (scale bar = 20 μm). Error bars indicate standard error (n = 3); one‐way ANOVA was used for statistical analysis, **P < 0.01; ***P < 0.001.
