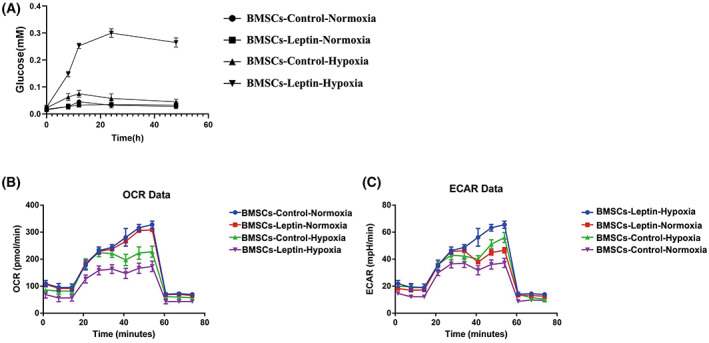
Fig. 4.

Glycolysis was induced by leptin treatment in the hypoxic environment. (A) Following leptin treatment, BMSCs were exposed to hypoxia and glucose for 48 h. The glucose content was determined using the glucose oxidase method. (B) Mitochondrial oxygen consumption rate (OCR) was determined in BMSCs‐control (without leptin) and BMSCs‐leptin (with leptin) using an Oroboros instrument. (C) Following exposure to hypoxia for 48 h, the rate of extracellular acidification (ECAR) of BMSCs was measured and is shown as a percentage relative to untreated control BMSCs. Error bars indicate standard error (n = 3); one‐way ANOVA was used for statistical analysis.
