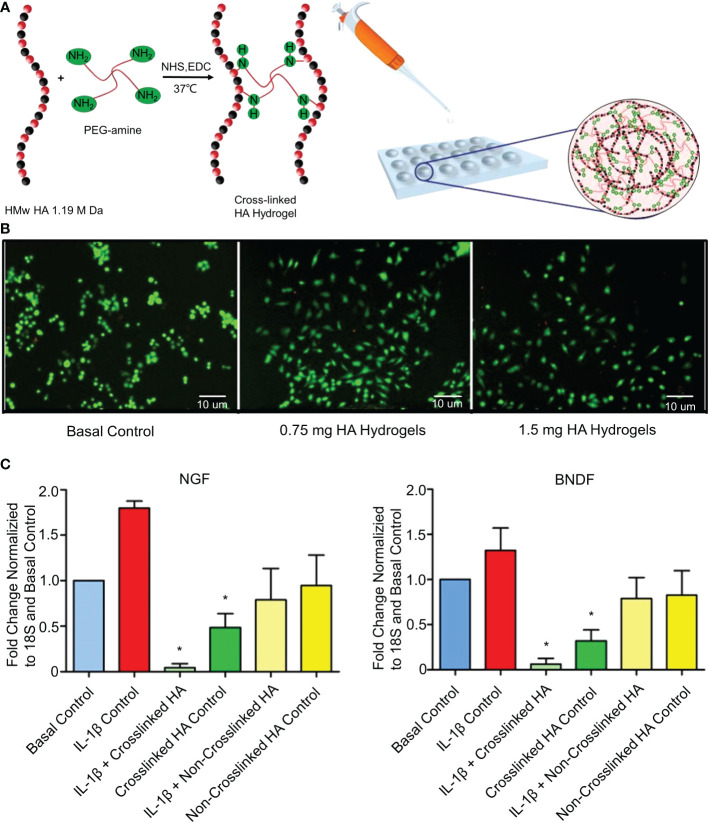
Figure 3.
(A) Schematic diagram of the synthesis of the cross-linked HA hydrogel system. (B) Stained NP cell morphology by the LIVE/DEAD assay after 3 days of culture in the presence of hydrogels containing different doses of HA. Live cells are green (calcein staining) and dead cells are red (ethidium bromide staining). (C) Fold changes of NGF and BNDF downregulated in IL-1β-induced inflammation and normal NP cells treated with cross-linked HA hydrogels for 7 days. Reproduced with permission from (46). *Indicates significant difference at a 99 %confidence level.

