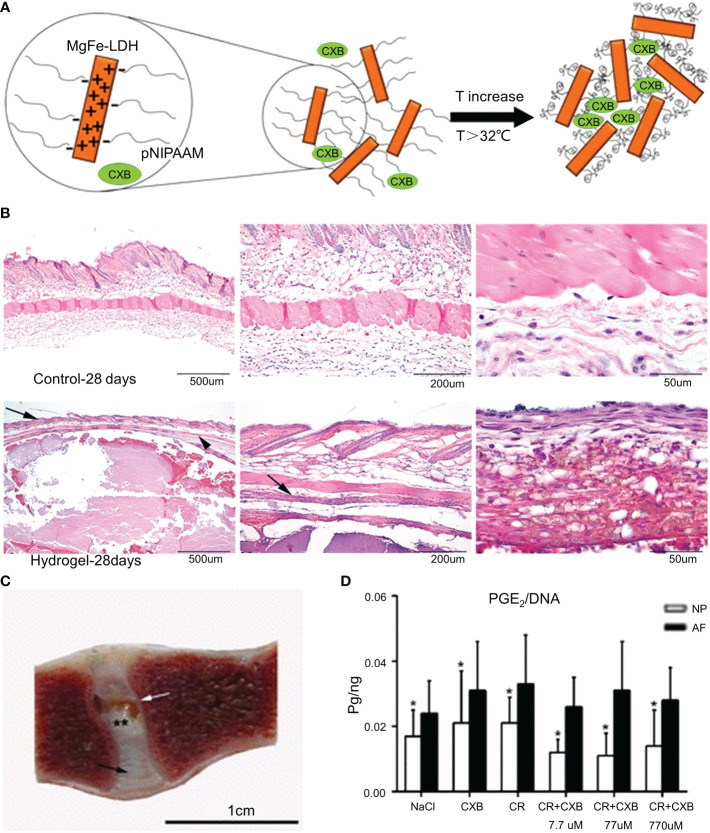
Figure 5.
(A) Schematic diagram of the synthesis of the pNIPAAM hydrogel. (B) Histological staining (hematoxylin and eosin staining) of the hydrogel and control group after 28 days in mice. The epidermis and flesh lipid membranes are indicated by the arrows. (C) One month after the intradiscal injections, the pNIPAAM hydrogel (white arrow) was visible in the NP. (D) The DNA level in PGE 2NP was significantly lower than that in AF in all treatments. Reproduced with permission from (50). *Indicates significant difference at a 99 % confidence level P ≤ 0.05. **Indicates significant difference at a 99 % confidence level P ≤ 0.01.

