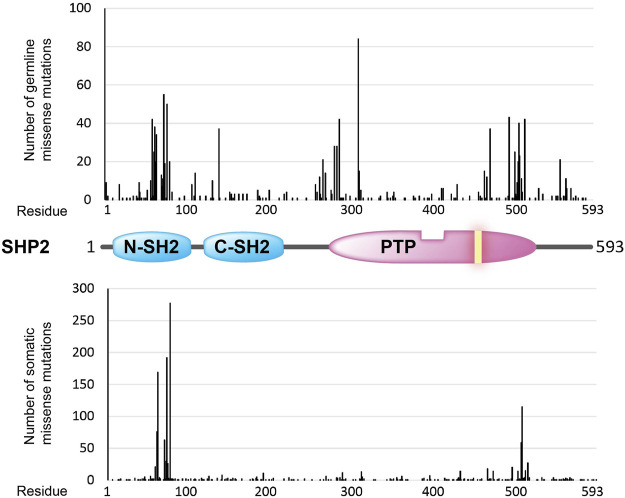
FIGURE 3.
Overview of amino acid positions (x-axis) in the SHP2 protein (structural cartoon in the middle) that are found mutated (missense mutations) in the germline (top graph; ClinVar counts) and in sporadic cancer cases (lower graph; COSMIC counts). Occurrence frequencies (y-axis) are represented by the vertical black bars. The catalytic PTP domain and the Src homology type 2 (SH2) domains are depicted as in Figure 1. The yellow bar in the PTP segment indicates the position of the essential catalytic site cysteine.

