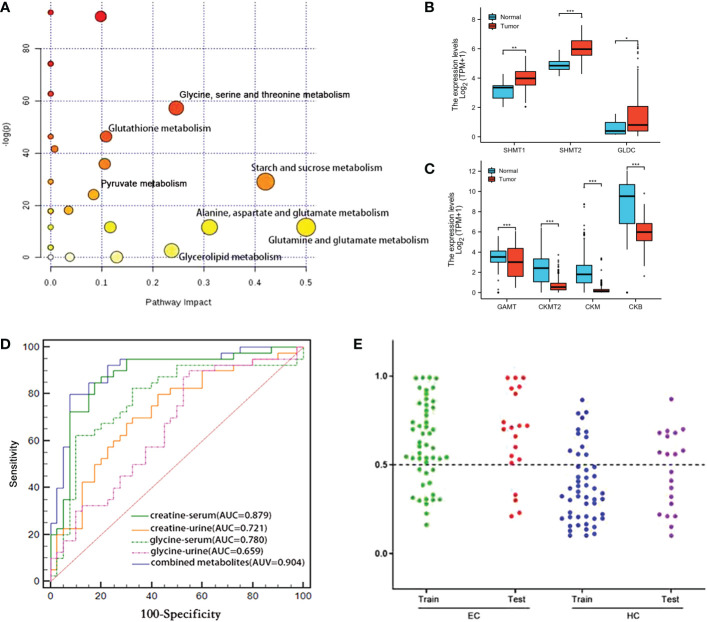
Figure 4.
(A) Metabolic pathways associated with various metabolic alterations in ESCC vs. HCs. (B, C) Comparison of the metabolic enzyme gene expression related to “glycine, serine and threonine metabolism” between ESCC cancer tissues and normal tissues (ns, p≥0.05; *, p< 0.05; **, p<0.01; ***, p<0.001). (D) Comparison of the ROC curves used for distinguishing ESCC patients from HCs, based on the levels of various individual serum and urine metabolites and a combined set of metabolites. (E) Prediction and validation of the diagnostic accuracy of the optimal combined biomarker panel for ESCC detection (“training set”: ESCC=50, HC=50; “discovery set”: ESCC=20, HC=20). ns, not statistically significant.

