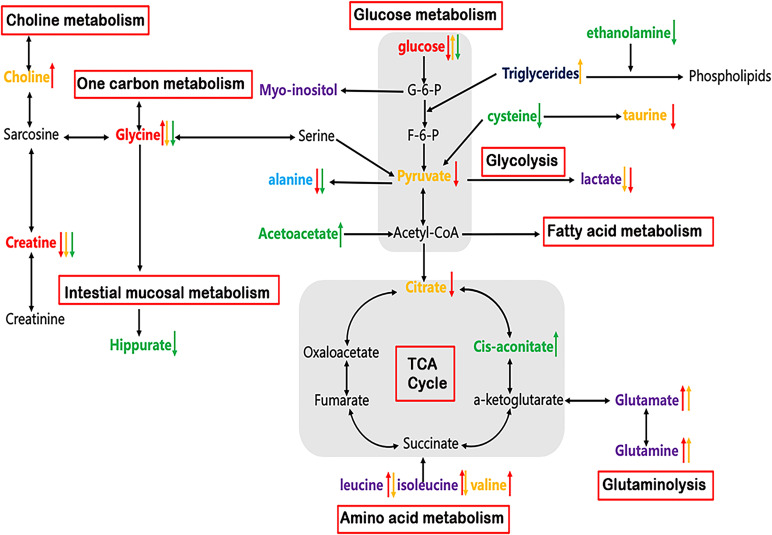
Figure 6.
Altered metabolic pathways for the most relevant distinguishing metabolites (Red: common changed metabolites in tissue, serum and urine; Purple: changed metabolites in both tissue and serum; Light blue: changed metabolites in both tissue and urine; Yellow: tissue-specific metabolites; Navy: serum-specific metabolites; Green: urine-specific metabolites. Red arrow: increased or decreased with respect to control in tissue; Yellow arrow: increased or decreased with respect to control in serum; Green arrow: increased or decreased with respect to control in urine).

