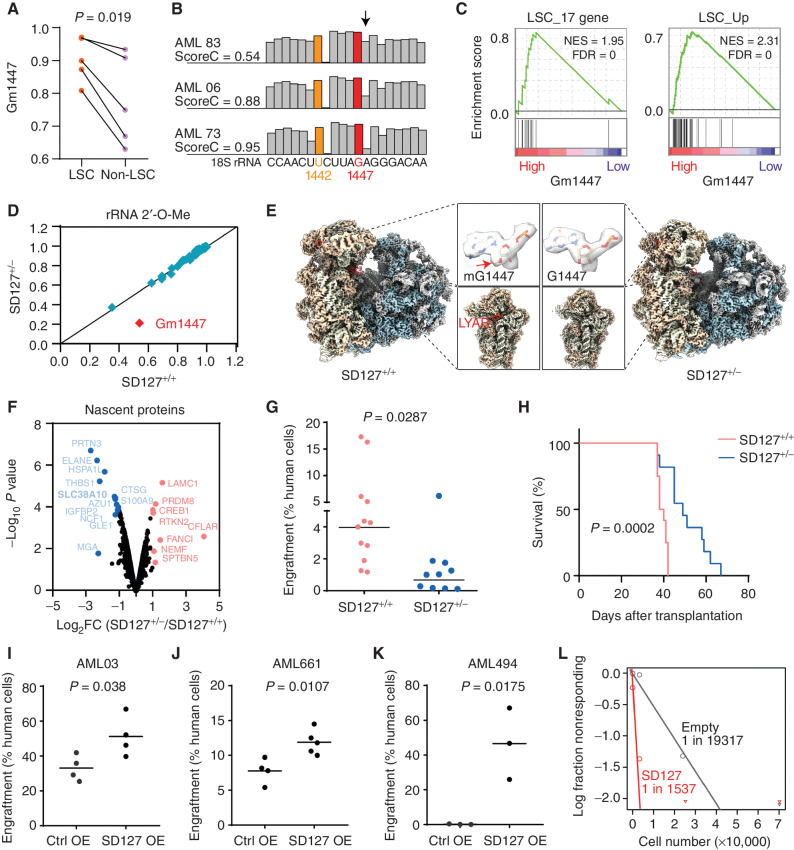
Figure 4.
Gm1447 determines LSC activity. A, Methylation levels on G1447 in 5 matched LSC and non-LSC fractions as described in Fig. 1G. Indicated P values by Student paired t test. B, Variability of Gm1447 in primary AML samples. Shown are 3 patients with high, medium, and low Gm1447, respectively. G1447 is shown in red, and U1442 with constitutive full methylation in human AMLs is shown in yellow. The arrow indicates +1 position to G1447 that the calculation of the Gm1447 level (score C) is based on (see Methods). C, Gene set enrichment analysis showing that samples with high Gm1447 are enriched for LSC genes. Samples were split into two equal groups at a median of Gm1447. NES, normalized enrichment score. D, Comparison of rRNA 2′-O-Me in SNORD127+/+ and SNORD127+/− Kasumi-1 cells. E, Cryo-EM maps of the 80S ribosome from SNORD127+/+ and SNORD127+/− Kasumi-1 cells. Highlighted are the 2′-O-Me density at G1447 and the decoding center of the 40S ribosomal subunit. The arrow indicates a density bump of 2′-O-Me on G1447 in SNORD127+/+ cells. F, Nascent proteomics from SNORD127+/+ and SNORD127+/− Kasumi-1 cells. Decreased nascent proteins in SNORD127+/− cells are labeled in blue, and increased nascent proteins are in red. G, Engraftment of SNORD127+/+ and SNORD127+/− OCI-AML2 cells in NSG mice (percentages of leukemic cells among bone marrow cells; each dot represents one mouse; n = 12 mice for the SNORD127+/+ group and n = 10 mice for SNORD127+/−). Two different single clones per group were used for transplantation. Short horizontal line indicates the mean; P values are indicated by Student unpaired t test. H, Survival of mice transplanted with SNORD127+/+ and SNORD127+/- OCI-AML2 cells. n = 12 mice for control group and n = 10 mice for SNORD127+/−. Indicated P value by log-rank test. I–K, Engraftment of primary AML cells AML03 (I), AML661 (J), and AML494 (K) transduced with empty vector or SNORD127. Each dot represents the bone marrow engraftment in one mouse. Short horizontal line indicates mean; P values are indicated by Student unpaired t test. OE, overexpression. L, Absolute LSC frequency in primary AML494 cells overexpressing empty vector or SNORD127 estimated by in vivo limiting dilution assay. P = 0.0015, Chi-square test.

