. 2022 Nov 9;13(2):364–385. doi: 10.1158/2159-8290.CD-22-0199

Figure 5.

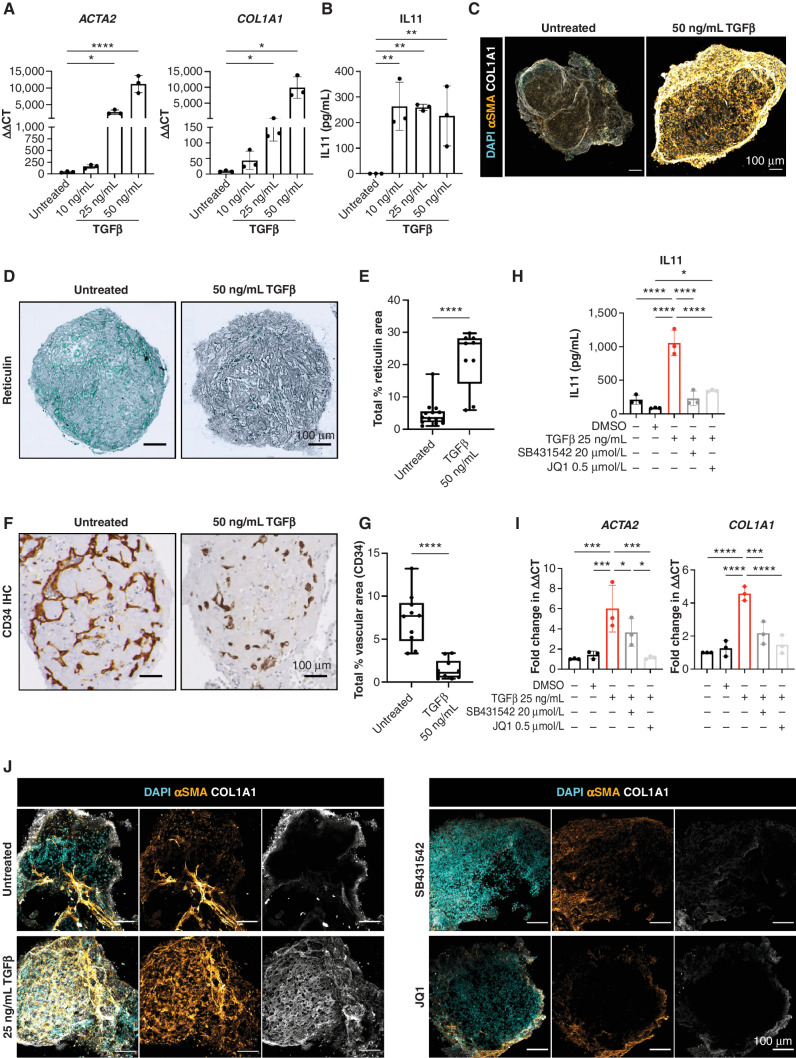
Figure 5. Bone marrow organoids model TGFβ-induced bone marrow fibrosis and enable inhibitor screening. A, Organoids were treated with 10, 25, or 50 ng/mL recombinant TGFβ and evaluated by qRT-PCR for expression of ACTA2 (αSMA) and COL1A1, indicators of fibrosis. B, Soluble IL11 detected in organoid media following treatment of organoids with TGFβ. C, Confocal Z-stack images of whole, untreated, and TGFβ (50 ng/mL)-treated organoids stained for αSMA and COL1A1. D, Reticulin staining of formalin-fixed, paraffin-embedded sections of TGFβ-treated organoids vs. control. E, Measurement of total reticulin stained area in untreated and TGFβ (50 ng/mL)-treated organoids. F, CD34 immunostaining of organoid vessels and (G) quantification of total vascular area of organoids with/without TGFβ treatment. H, Effect of two potential inhibitors of TGFβ-induced fibrosis (SB431542 and JQ1) on IL11 secretion and (I) ACTA2 and COL1A1 expression. J, αSMA and COL1A1 expression in TGFβ-treated organoids with/without indicated inhibitors. Representative images are shown. *, P < 0.01; **, P < 0.05; ***, P < 0.001; ****, P < 0.0001 for one-way ANOVA with multiple comparisons (Fisher LSD). T tests performed for image analysis of paraffin-embedded sections (reticulin and CD34). N = 3 with each repeat comprising 15 organoids pooled from 3 independent differentiations and treatments.

Bone marrow organoids model TGFβ-induced bone marrow fibrosis and enable inhibitor screening. A, Organoids were treated with 10, 25, or 50 ng/mL recombinant TGFβ and evaluated by qRT-PCR for expression of ACTA2 (αSMA) and COL1A1, indicators of fibrosis. B, Soluble IL11 detected in organoid media following treatment of organoids with TGFβ. C, Confocal Z-stack images of whole, untreated, and TGFβ (50 ng/mL)-treated organoids stained for αSMA and COL1A1. D, Reticulin staining of formalin-fixed, paraffin-embedded sections of TGFβ-treated organoids versus control. E, Measurement of total reticulin stained area in untreated and TGFβ (50 ng/mL)-treated organoids. F and G, CD34 immunostaining of organoid vessels (F) and quantification of total vascular area of organoids with/without TGFβ treatment (G). H and I, Effect of two potential inhibitors of TGFβ-induced fibrosis (SB431542 and JQ1) on IL11 secretion (H) and ACTA2 and COL1A1 expression (I). J, αSMA and COL1A1 expression in TGFβ-treated organoids with/without indicated inhibitors. Representative images are shown. *, P < 0.01; **, P < 0.05; ***, P < 0.001; ****, P < 0.0001 for one-way ANOVA with multiple comparisons (Fisher least significant difference). T tests performed for image analysis of paraffin-embedded sections (reticulin and CD34). n = 3 with each repeat comprising 15 organoids pooled from 3 independent differentiations and treatments.