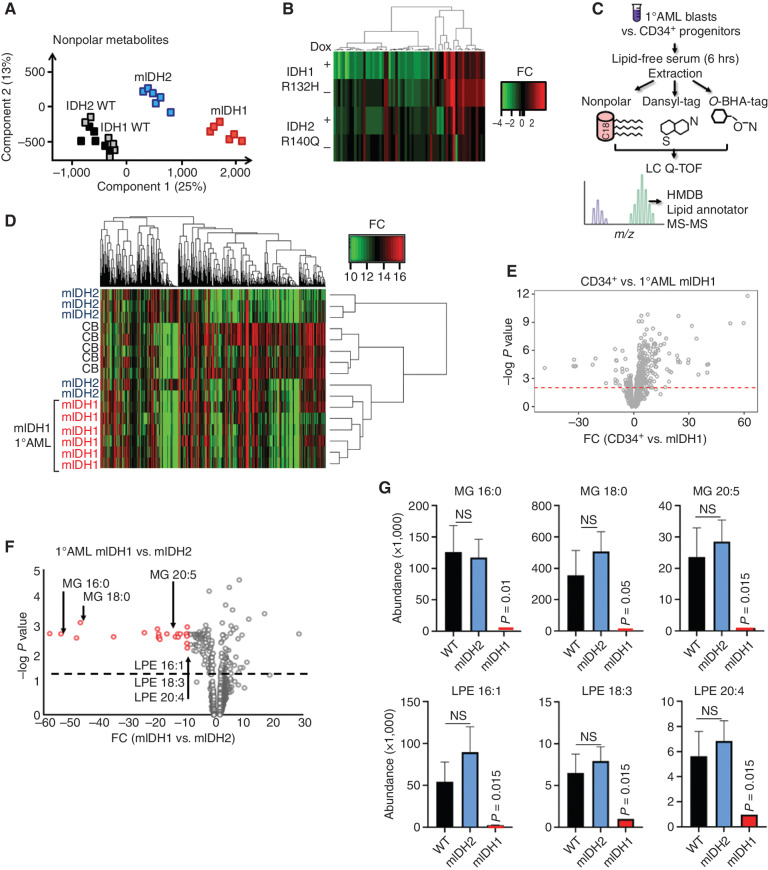
Figure 2.
IDH1-mutant AML associated with decreased single-chain fatty acid metabolites. A, Principal component analysis of extracted nonpolar metabolites identified by mass spectrometry in negative ion mode from THP-1 cells cultured in low serum media following induction of mIDH1 R132H, mIDH2 R140Q, wild-type IDH1, or wild-type IDH2. B, Heat map showing differentially abundant nonpolar lipid species globally decreased in IDH1 R132H THP-1 cells (+dox) compared with IDH2 R140Q (+dox) vs. no-dox controls. C, Schematic showing metabolomics protocol for extracting nonpolar lipid species using organic solvent and derivatization of polar metabolites with O-benzylhydroxylamine and dansyl-tags from primary cell AML extracts. Putative metabolite identifications based on mass/charge ratio and retention time were determined from the Human Metabolome Database, Lipid Annotator software, and a validated in-house lipidomics fragmentation library. HMDB, Human Metabolome Database. D, Heat map showing clustering of primary AML samples based on differentially abundant metabolites (all metabolites, both polar and nonpolar). mIDH1 samples are shown in red. CB, cord blood. E, Volcano plot highlighting significant differentially abundant metabolites in healthy IDH1 wild-type CD34+ progenitors vs. mIDH1 AML. Red dashed line indicates a nonadjusted P value threshold of 0.05. F, Volcano plot highlighting significant differentially abundant metabolites in 6 × mIDH1 vs. 5 × mIDH2 AML samples. Dashed line indicates a nonadjusted P value threshold of 0.05. G, Representative examples of distinct lipid metabolites with decreased abundance in IDH1-mutant vs. IDH2-mutant AML and wild-type AML; x-axis shows metabolite abundance. Bars represent standard error of independent samples. All P values represent comparison with wild-type. LPE, lysophosphatidylethanolamine; MG, monoacylglycerolipids; NS, nonsignificant; WT, wild-type.

