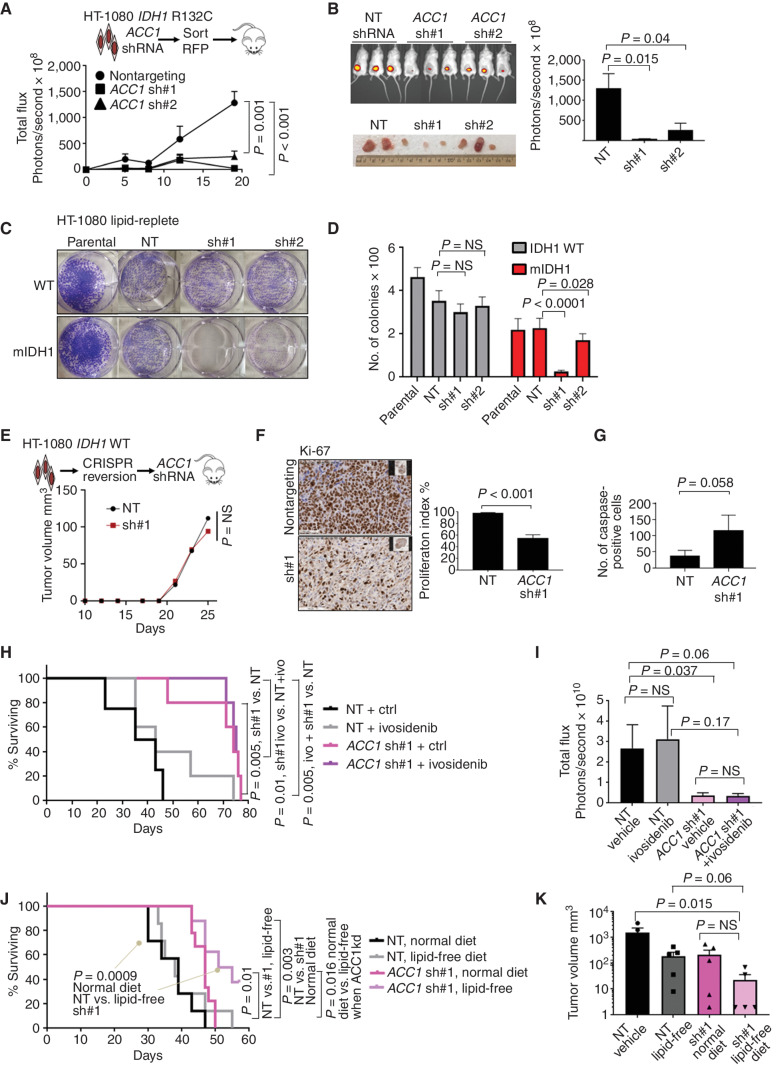
Figure 5.
ACC1 is a potential target in IDH1-mutant solid tumors. A, Growth of HT-1080 tumors over 21 days after knockdown of ACC1 measured by intravital imaging of shRNA-transduced luciferase+ cells. B,In vivo imaging of tumors from the same experiment. C, Colony assays quantified by crystal violet showing decreased colonies in mIDH1 with ACC1 knockdown compared with wild-type in lipid-replete conditions. D, Column graphs showing mean number of colonies after seeding 2,500 cells per well; bars represent standard error of the mean from 2 independent experiments. E,In vivo growth of IDH1 wild-type HT-1080 cells after CRISPR–Cas9 correction. Plots show median tumor growth after 25 days. P = nonsignificant; Mann–Whitney U test. F, Ki-67 IHC stain of explanted HT-1080 (5 tumors × 10 fields of view) after ACC1 knockdown compared with control with Student t test. Right, quantification of the Ki-67 proliferation index in tumors with ACC1 knockdown vs. control. G, Summary bar graph of 5 tumors × 10 fields of view showing increased apoptosis in ACC1 knockdown explants as measured by IHC staining of cleaved caspase-3 in explanted tumors. H, Kaplan–Meier log-rank survival curve for NSG mice transplanted with HT-1080 cells comparing ACC1 knockdown (pink) to nontargeting control (black) ± ivosidenib (ivo) treatment 25 mg/kg/day (gray, purple) or vehicle given by oral gavage for 50 days. Mice eventually succumbed by 72 days in all treatment groups due to increased tumor growth requiring euthanasia. P values represent log-rank Mantel–Cox test between groups as indicated. I, Bar graph summarizing total flux (photons per second) based on intravital imaging at day 21 for the same experiment. Student t test with indicated P values assessed statistical significance. J, Kaplan–Meier log-rank survival curve for NSG mice transplanted with HT-1080 cells and fed lipid-free vs. normal (lipid-replete) rodent diet. As in the previous experiment, mice eventually succumbed by day 70 in all treatment groups due to increased tumor growth. P values represent log-rank Mantel–Cox test between groups as indicated. kd, knockdown. K, Bar graph summarizing tumor size at 21 days after engraftment as measured by calipers. NS, nonsignificant; NT, nontargeting; WT, wild-type.

