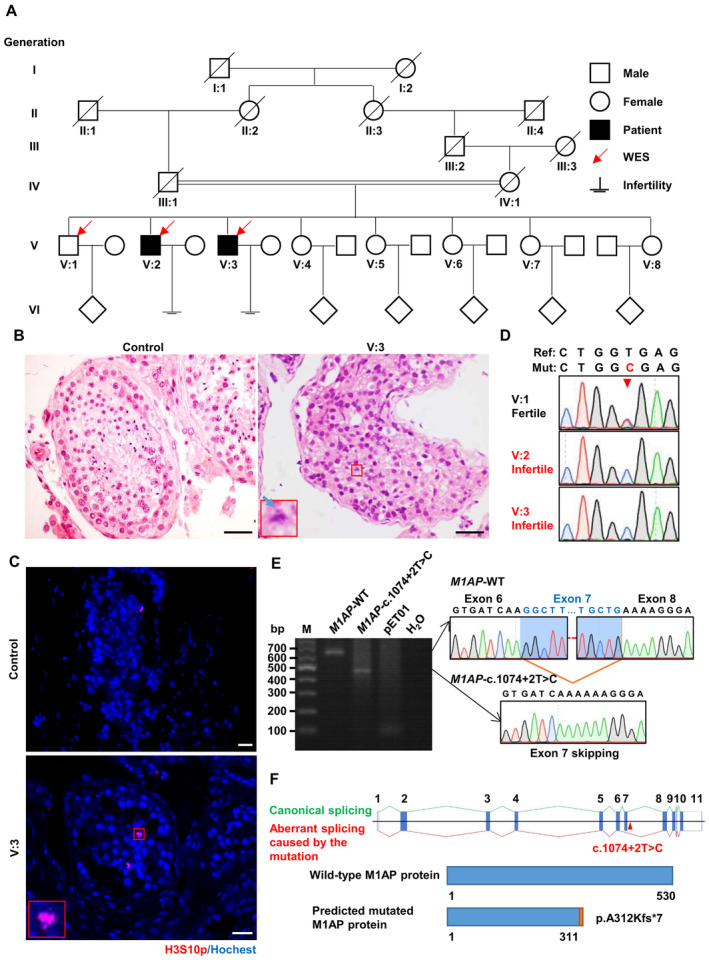
The family pedigree. Arrows represent the individuals for whom whole‐exome sequencing was performed. Squares represent males, circles represent females, diamonds indicate offspring, and the slash symbols denote deceased family members. Solid squares indicate male patients suffering from severe oligozoospermia. Double horizontal lines indicate consanguineous marriage.
Representative images of hematoxylin and eosin‐stained testicular sections from the patient (V:3) and a man diagnosed with obstructive azoospermia, serving as the control. The magnified view of the boxed area is shown in the lower left corner of the image from the patient. The blue arrow indicates unaligned chromosomes in the representative metaphase cells. Scale bars, 50 μm.
Immunofluorescence staining of testicular sections from control and patient V:3 with antibodies against H3S10p (red), a marker of metaphase cells. The nuclei were stained with Hoechst 33342 (blue). The magnified view of the red box is shown in the lower left corner of the image from the patient. Scale bars, 50 μm.
Sanger sequencing chromatograms showing the homozygous M1AP splicing mutation in patients and heterozygous mutation in their fertile brother. The arrowhead indicates the position of the mutation.
Reverse transcription–PCR products of the pET01 empty vector and vectors expressing the wild‐type or c.1074 + 2T > C M1AP mini gene (containing genomic sequences spanning intron 5–6 and intron 8–9) in HEK‐293T cells. The splicing products of wild‐type and mutant mini genes were detected by Sanger sequencing. The wild‐type transcript is spliced canonically, while the mutant transcript is aberrantly spliced, leading to the skipping of exon 7. M, marker.
Schematic representation of the aberrant splicing and the predicted protein truncation caused by the M1AP mutation. Vertical solid bars indicate exons of the human M1AP gene. The M1AP mutation (c.1074 + 2T > C) is located in intron 7–8 near exon 7 (Ensembl transcript ID ENST00000421985.2) and is indicated by the arrowhead. Green lines represent canonical splicing, and red lines represent aberrant splicing caused by the M1AP mutation.

