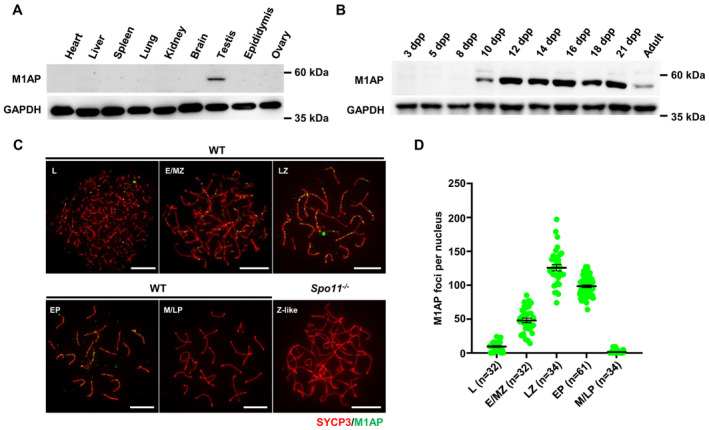
Figure 2. M1AP forms discrete foci on the chromosome axes in spermatocytes.

- Western blot analysis of M1AP expression in various tissues from adult wild‐type (WT) mice. GAPDH served as the loading control.
- Western blot analysis of M1AP expression in testes from mice at different days postpartum (dpp). GAPDH served as the loading control.
- Immunofluorescence staining of M1AP (green) and SYCP3 (red) on spermatocyte spreads of WT or Spo11 −/− mice. Scale bar, 10 μm.
- Quantification of M1AP foci in WT spermatocytes at the indicated stages. L, leptotene; E/MZ, early/mid zygotene; LZ, late zygotene; EP, early pachytene; M/LP, mid/late pachytene; Z‐like, zygotene‐like. Data are presented as the mean ± SEM. n shows the number of spermatocytes analyzed from three biological replicates.
