
Figure EV2. The phenotype of M1ap KI/KI mice.
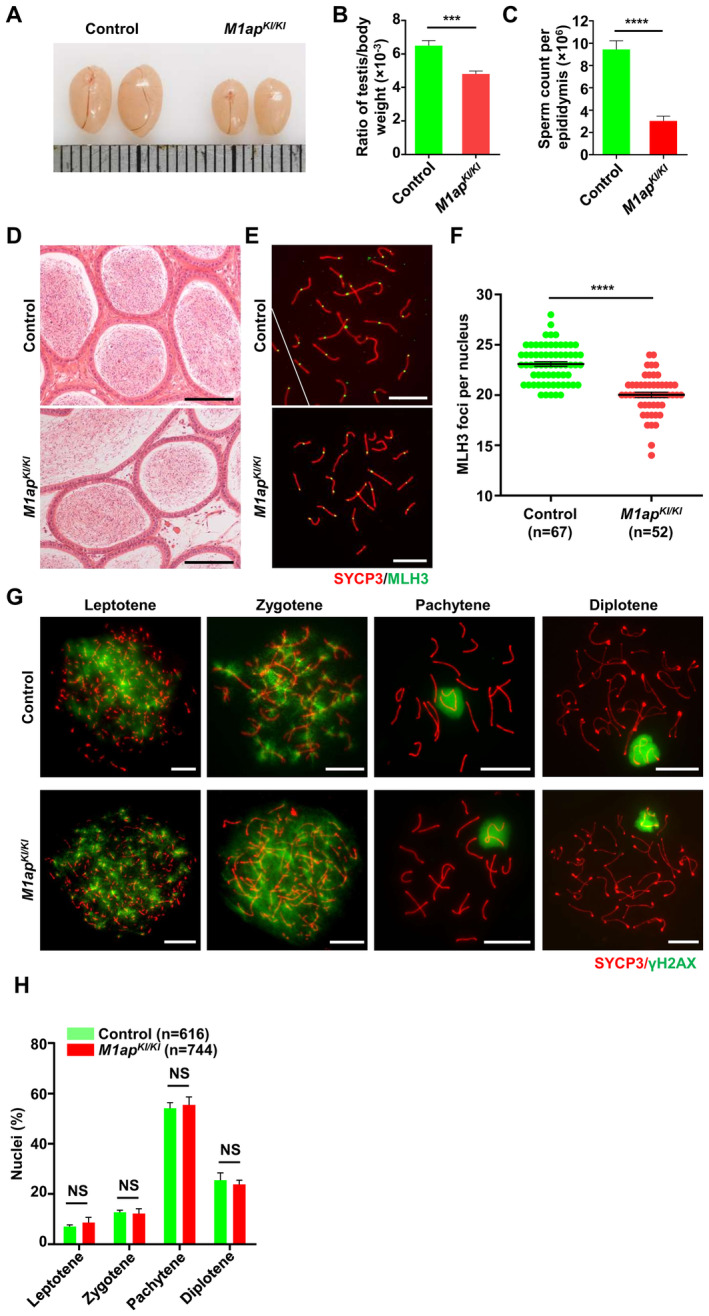
- Representative images of testes from 8‐week‐old control and M1ap KI/KI mice. Each grid represents 1 mm.
- The ratio of testis/body weight of 8‐week‐old control and M1ap KI/KI mice.
- The sperm count per epididymis of 8‐week‐old control and M1ap KI/KI mice.
- Representative images of hematoxylin and eosin‐stained sections of cauda epididymides from 8‐week‐old wild‐type and M1ap KI/KI mice. Scale bars, 50 μm.
- Immunofluorescence staining of SYCP3 (red) and MLH3 (green) in spermatocyte spreads from 8‐week‐old control and M1ap KI/KI mice. Scale bars, 10 μm.
- Number of MLH3 foci per cell in control and M1ap KI/KI spermatocytes.
- Immunofluorescence staining of SYCP3 (red) and γH2AX (green) on spermatocyte spreads from 8‐week‐old control and M1ap KI/KI mice. Scale bars, 10 μm.
- The percentages of spermatocytes at each stage of meiotic prophase I in 8‐week‐old control and M1ap KI/KI mice.
Data information: (B and C), Data are shown as the mean ± SEM of three biological replicates. (F and H) Data are shown as the mean ± SEM. n shows the number of cells scored from three biological replicates. **P < 0.01; ***P < 0.001; ****P < 0.0001; NS, not significant; two‐tailed Student's t‐test.