-
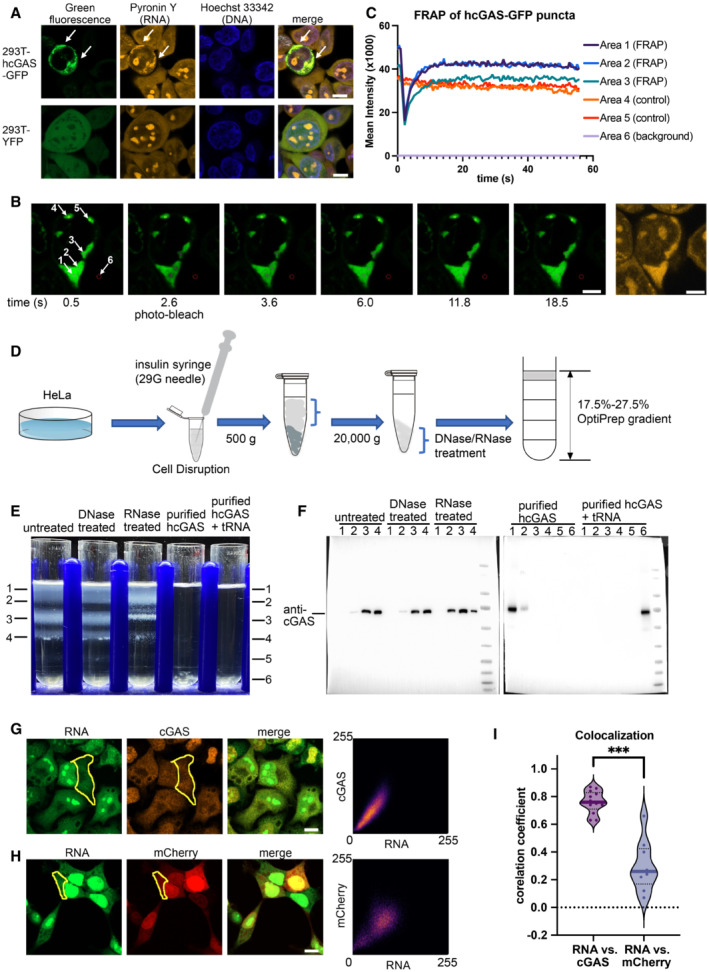
A
Hoechst 33342 and pyronin Y staining of HEK293T cells showing colocalization of the hcGAS‐GFP granules and RNAs (n = 3, biological replicates, data from one representative independent biological replicate are shown). Expression of the hcGAS‐GFP was induced by doxycycline at a concentration of 0.1 μg/ml. HEK293T cells that express YFP were used as the negative controls. The scale bars represent 10 μm.
-
B, C
Fluorescence recovery after photo‐bleaching (FRAP) assay of hcGAS‐GFP granules in HEK293T cells (n = 4, biological replicates, data from one representative independent biological replicate are shown). (B) Images (left 1–6) of a 293T cell showing the hcGAS‐GFP signal in the cell. The selected areas are indicated with circles and arrows and are numbered in the left‐most image. Areas 1, 2, and 3 were photo‐bleached at the time indicated below images. Areas 4 and 5 were not photo‐bleached and were used as the controls. Signal in area 6 was taken as background. The yellow fluorescence image on the right showing the pyronin Y‐stained RNA signal, which colocalizes with the hcGAS‐GFP signal in the cytoplasm. The scale bars represent 5 μm. (C) Quantification of the fluorescence intensity changes in the 6 selected areas of the FRAP assay indicated in panel “B.”
-
D
A schematic diagram showing the HeLa cell cytoplasm extraction and fractionation procedure. To release the cytoplasm without disrupting the nuclear membrane, the cell membranes were disrupted by suspension in a hypotonic buffer and passing the cells through a 29G needle three times. The hypotonic buffer contains 10 mM HEPES at pH 7.5, 5 mM KCl and 3 mM MgCl2.
-
E
OptiPrep density gradient analyses of the HeLa cell cytoplasm extracts and purified hcGAS with and without tRNA (n = 3, biological replicates, data from one representative independent biological replicate are shown).
-
F
Western blot analysis of the OptiPrep gradient fractions with or without DNase and RNase treatments.
-
G
The three images on the left showing fluorescence signals of endogenous cGAS and RNA in HeLa cells (n = 13, biological replicates, data from one representative independent biological replicate are shown). The scale bar represents 10 μm. The scatterplot on the right plots the signal intensities of cGAS versus RNA at each pixel in the indicated cytoplasmic area (yellow circle).
-
H
The three images on the left showing the fluorescence signals of mCherry and RNA in HEK293T cells (n = 9, biological replicates, data from one representative independent biological replicate are shown). The scale bar represents 10 μm. The scatterplot on the right plots signal intensities of mCherry versus RNA at each pixel in the indicated cytoplasmic area (yellow circle).
-
I
Pearson's correlation coefficient (CC) analysis of the fluorescence signals of cGAS vs. RNA (n = 13, biological replicates), and mCherry vs. RNA (n = 9, biological replicates). The median values were calculated and used for the evaluation of significance. ***P < 0.001 (two‐tailed Mann–Whitney test).

