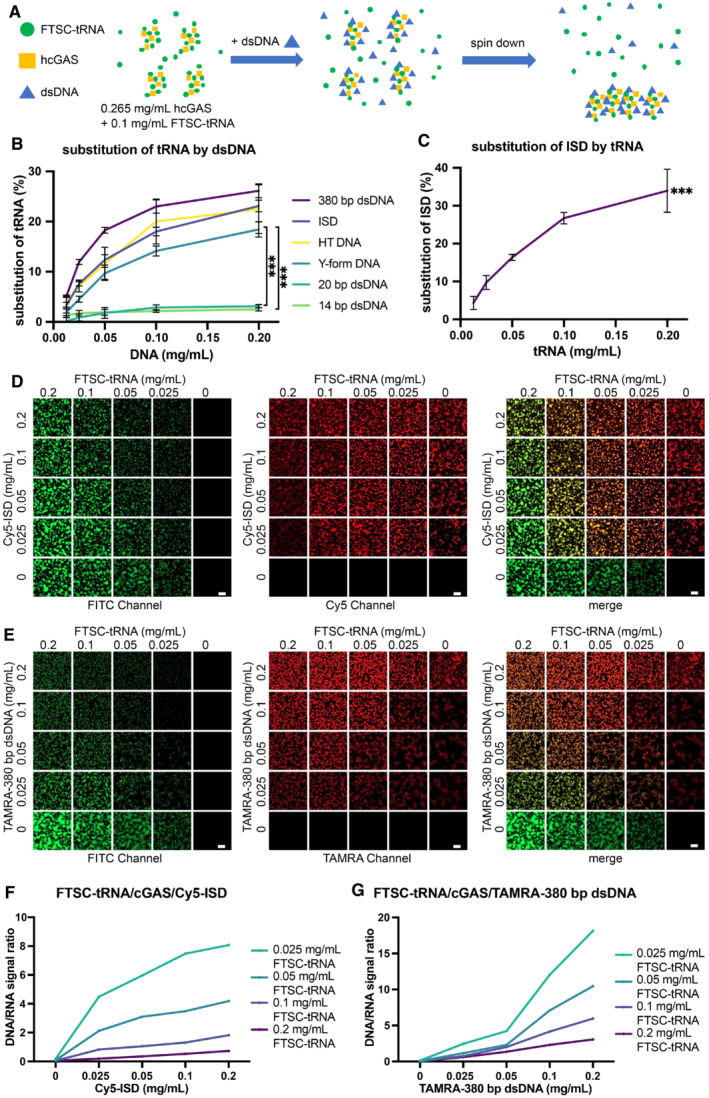
A schematic diagram of the methods used to quantify tRNA/dsDNA released from the phase‐separated granules. FTSC‐tRNA and FL‐hcGAS were premixed. dsDNA was added, and the sample was centrifuged. The fluorescence signal of FTSC‐tRNA in supernatant was measured.
The percentage of FTSC‐tRNA released into the supernatant after the addition of the indicated dsDNA as measured by fluorescence spectroscopy (n = 3, biological replicates). The percentage of FTSC‐tRNA released from the condensates was calculated by using the following equation: P = (Fi–F0) * 100/(F–F0). P: percentage of substituted FTSC‐tRNA. Fi: fluorescence of FTSC‐tRNA in the supernatant of each test. F0: fluorescence signal of FTSC‐tRNA in the supernatant when DNA was not added. F: fluorescence signal of FTSC‐tRNA without the addition of DNA and cGAS. The dsDNAs tested were ISD, 14‐bp dsDNA, 20‐bp dsDNA, 380‐bp dsDNA, herring testis DNA (HT DNA) and Y‐form DNA (a 14‐bp dsDNA with unpaired GGG on each end). Data are presented as mean ± SD. Significance was calculated for Y‐form DNA vs. 14‐bp dsDNA and Y‐from DNA vs. 20‐bp dsDNA, ***P < 0.001 (two‐way ANOVA).
The percentage of Cy5‐ISD released into the supernatant over time after the addition of yeast tRNA as measured by fluorescence spectroscopy (n = 3, biological replicates). The yeast tRNA was used to trigger the release of the ISD from the phase separations of cGAS‐ISD. The percentage of Cy5‐ISD released from the condensates was calculated by using the following equation: P = (Fi–F0) * 100/(F–F0). P: percentage of substituted Cy5‐ISD. Fi: fluorescence signal of Cy5‐ISD in the supernatant of each test. F0: fluorescence signal of Cy5‐ISD in the supernatant when tRNA was not added. F: fluorescence signal of Cy5‐ISD without adding tRNA and cGAS. Data are presented as mean ± SD. ***P < 0.001 (one‐way ANOVA).
Fluorescence microscopy images showing the replacement of FTSC‐tRNA by Cy5‐ISD at indicated concentrations in preformed granules of hcGAS and FTSC‐tRNA (n = 2, biological replicates, data from one representative independent biological replicate are shown). In each square, a representative area that is 1/16 of the raw image is displayed. The scale bars represent 20 μm.
Fluorescence microscopy images showing the replacement of FTSC‐tRNA by TAMRA‐380‐bp dsDNA at indicated concentrations in preformed granules of hcGAS and FTSC‐tRNA (n = 2, biological replicates, data from one representative independent biological replicate are shown). In each square, a representative area that is 1/16 of the raw image is displayed. The scale bars represent 20 μm.
Quantification of the replacement in “D.” For each square, the raw image used was evenly divided into four parts. Fluorescence signal ratios of Cy5‐ISD over FTSC‐tRNA in the four parts were calculated, averaged and plotted.
Quantification of the replacement in “E.” For each square, the raw image used was evenly divided into four parts. Fluorescence signal ratios of TAMRA‐380‐bp dsDNA over FTSC‐tRNA in the four parts were calculated, averaged and plotted.

