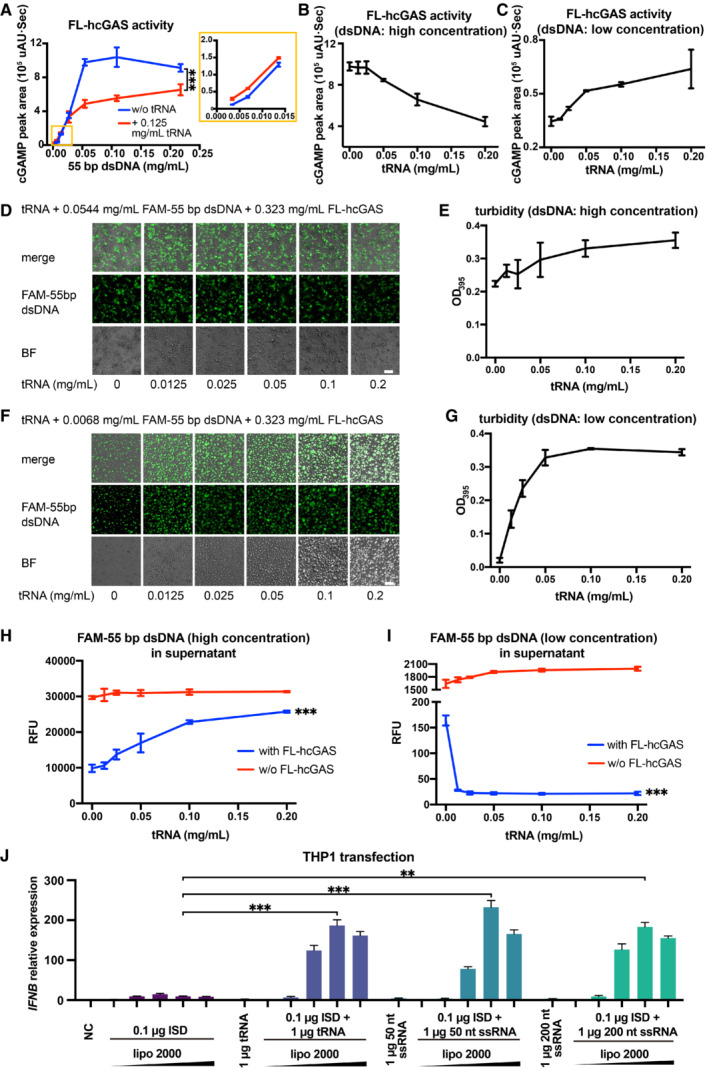
cGAS activity (as measured by the HPLC peak area of cGAMP) in the presence of a 55‐bp dsDNA at indicated concentrations and in presence or absence of 0.125 mg/ml tRNA (n = 3, biological replicates). The inset is an expanded view of the region boxed in yellow. ***P < 0.001 (two‐way ANOVA).
cGAS activity in the presence of 0.0544 mg/ml 55‐bp dsDNA and tRNA at indicated concentrations plotted as mean ± SD (n = 3, biological replicates).
cGAS activity in the presence of 0.0068 mg/ml 55‐bp dsDNA and tRNA at indicated concentrations (n = 3, biological replicates).
Fluorescence and bright‐field photographs of phase‐separated granules of FL‐hcGAS and 0.0544 mg/ml FAM‐labeled 55‐bp dsDNA in presence of tRNA at indicated concentrations (n = 2, biological replicates, data from one representative independent biological replicate are shown). The scale bar represents 20 μm.
Turbidities of FL‐hcGAS and 0.0544 mg/ml FAM‐labeled 55‐bp dsDNA in presence of tRNA at indicated concentrations as measured by absorption at 395 nm plotted as mean ± SD (n = 3, biological replicates).
Fluorescence and bright‐field photographs of phase‐separated granules of FL‐hcGAS and 0.0068 mg/ml FAM‐labeled 55‐bp dsDNA in presence of tRNA at indicated concentrations (n = 2, biological replicates, data from one representative independent biological replicate are shown). The scale bar represents 20 μm.
Turbidities of FL‐hcGAS and 0.0068 mg/ml FAM‐labeled 55‐bp dsDNA in presence of tRNA at indicated concentrations as measured by absorption at 395 nm plotted as mean ± SD (n = 3, biological replicates).
Fluorescence signals of the FAM‐labeled 55‐bp dsDNA in the supernatants of FL‐hcGAS and 0.0544 mg/ml FAM‐labeled 55‐bp dsDNA in presence of tRNA at indicated concentrations plotted as mean ± SD (n = 3, biological replicates). ***P < 0.001 (one‐way ANOVA).
Fluorescence signals of the FAM‐labeled 55‐bp dsDNA in the supernatants of FL‐hcGAS and 0.0068 mg/ml FAM‐labeled 55‐bp dsDNA in presence of tRNA at indicated concentrations (n = 3, biological replicates). ***P < 0.001 (one‐way ANOVA).
IFNB mRNA levels in THP1 cells induced by co‐transfecting dsDNA (ISD) and different RNAs (tRNA, 50 nt ssRNA and 200 nt ssRNA) plotted as mean ± SEM (n = 4, biological replicates). The volumes of Lipofectamine 2000 from low to high were 1, 2, 4, 6, and 8 μl. Significance was determined by two‐way ANOVA, **P < 0.01, ***P < 0.001.

