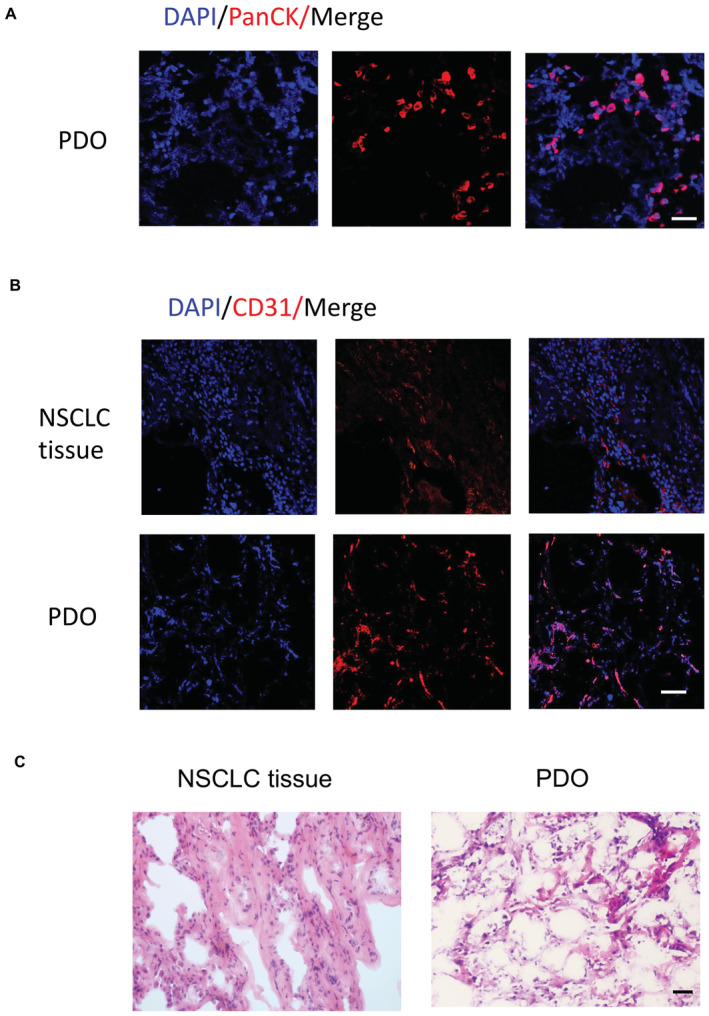
Figure EV1. Establishment of PDOs.

- Nuclei stained with DAPI (Scale bar, 50 μm). Representative from five samples.
- NSCLC tissues and corresponding PDOs were imaged for microvasculature by analyzing CD31‐expressing endothelial cells. Nuclei stained with DAPI (Scale bar, 100 μm). Representative from five samples.
- Representative H&E images of parental tumors and corresponding PDOs (Scale bar, 20 μm).
