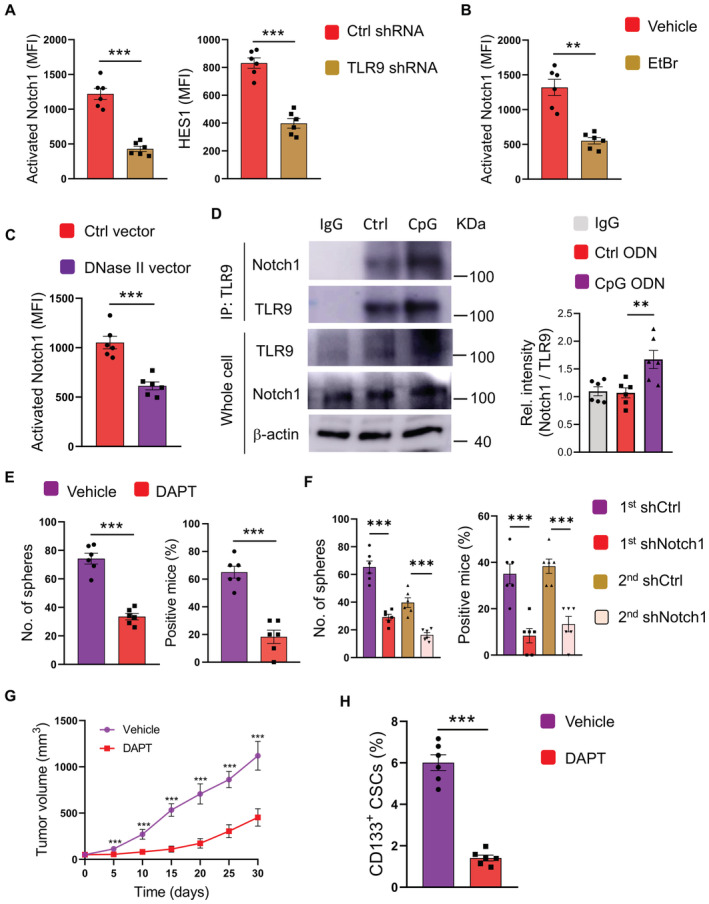
Figure 4. TLR9 promotes CSC expansion through Notch1 hyperactivity.

-
ACSCs transfected with TLR9 shRNA or control were analyzed for protein expressions of activated Notch1 plus HES1. Mean ± SEM from six patients.
-
BCSCs treated with or without EtBr (50 ng/ml) were analyzed for activated Notch1. Mean ± SEM from six patients.
-
CCSCs transfected with DNase II expression vector or control were analyzed for activated Notch1 expression. Mean ± SEM from six patients.
-
DCSCs with or without CpG treatment were analyzed for interaction between TLR9 and Notch1. Representative and mean ± SEM from six patients.
-
ECSCs were treated with CpG ODN (10 μg/ml) in the presence or absence of DAPT (10 μM), and analyzed for sphere formation plus tumorgenicity. Mean ± SEM from six experiments.
-
FCSCs were transfected with two different Notch1 shRNAs or control, treated with CpG ODN (10 μg/ml), and analyzed for sphere formation plus tumorgenicity. Mean ± SEM from six experiments.
-
G, HPDX chimeras treated by CpG with or without DAPT were analyzed for tumor growth and CD133‐expressing CSCs. Mean ± SEM from six mice.
Data information: Paired t‐test with Bonferroni method, **P < 0.01, ***P < 0.001.
Source data are available online for this figure.
