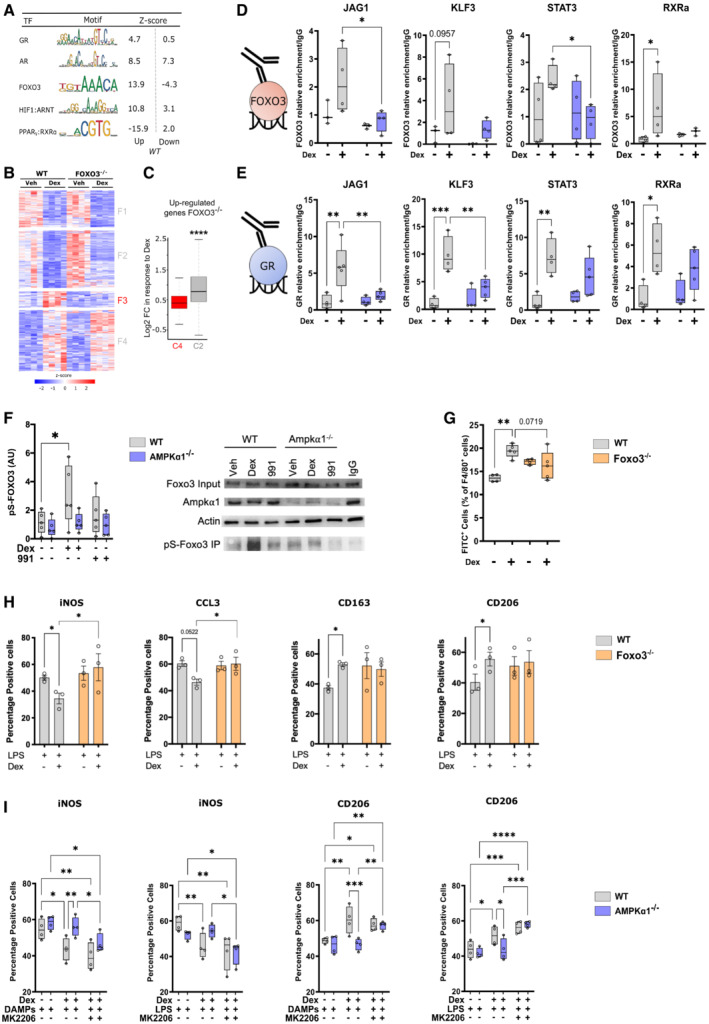
Figure 4. An AMPK‐GR‐FOXO3 trinity regulates glucocorticoid induction of restorative macrophages.

-
ATranscriptional regulators of differentially regulated identified by oPOSSUM were stratified into known interactors with AMPK.
-
BHeat map from RNA‐seq data performed in WT and FOXO3−/− macrophages treated or not with Dex clustered to show genes responsive in WT.
-
CBox plot of log2 fold change of genes upregulated in response to Dexamethasone (Dex) of genes in FOXO3−/− macrophages, stratified by AMPK dependency (clusters C4 and C2 of Fig 1E).
-
D, EFOXO3 (D) and GR (E) enrichment at GR binding sites for 4 AMPK‐dependent GC‐regulated genes.
-
FWT and AMPKα1−/− bone marrow‐derived macrophages (BMDMs) were treated with either Dex or the AMPK activator 991 and protein phosphorylated on serine were immunoprecipitated. Western blot for FOXO3, AMPKα1, actin and the phosphorylated form of FOXO3 were done. Quantification of the band intensity is provided normalized to those of actin and total FOXO3, a representative example is shown.
-
GFOXO3−/− BMDMs were treated or not with Dex and cultured with CSFE‐fluorescently labeled apoptotic thymocytes for 2.5 h. The number of macrophages with ingested apoptotic cells was evaluated by flow cytometry. Results are expressed as percentages of positive cells.
-
HWT and FOXO3−/− BMDMs were treated with LPS for 24 h prior addition of Dex for 6 h; immunofluorescence for pro‐ (iNOS, CCL3) and anti‐ (CD163, CD206) inflammatory markers was performed.
-
IWT and AMPKα1−/− BMDMs were treated with either lipopolysaccharide (LPS) or muscle Damaged Associated Molecular Patterns (DAMPs) for 24 h and further treated with the AKT inhibitor MK2206 for 1 h prior addition of Dex for 6 h; before immunofluorescence for pro‐ (iNOS) and anti‐ (CD206) inflammatory markers was performed. Results are expressed as percentages of positive cells.
Data information: results are z‐score of 4 (B), or box and whiskers in which the central band represents the median (D–G, I) or means ± SEM (I). N = 4–6 (D, E), 4–5 (F, G), 3 (H), 4 (I) biological replicates. *P < 0.05, **P < 0.01, ***P < 0.001 ****P < 0.0001 using Mann–Whitney–Wilcoxon test (C) or ANOVA and Kruskal–Wallis tests (D–I).
Source data are available online for this figure.
