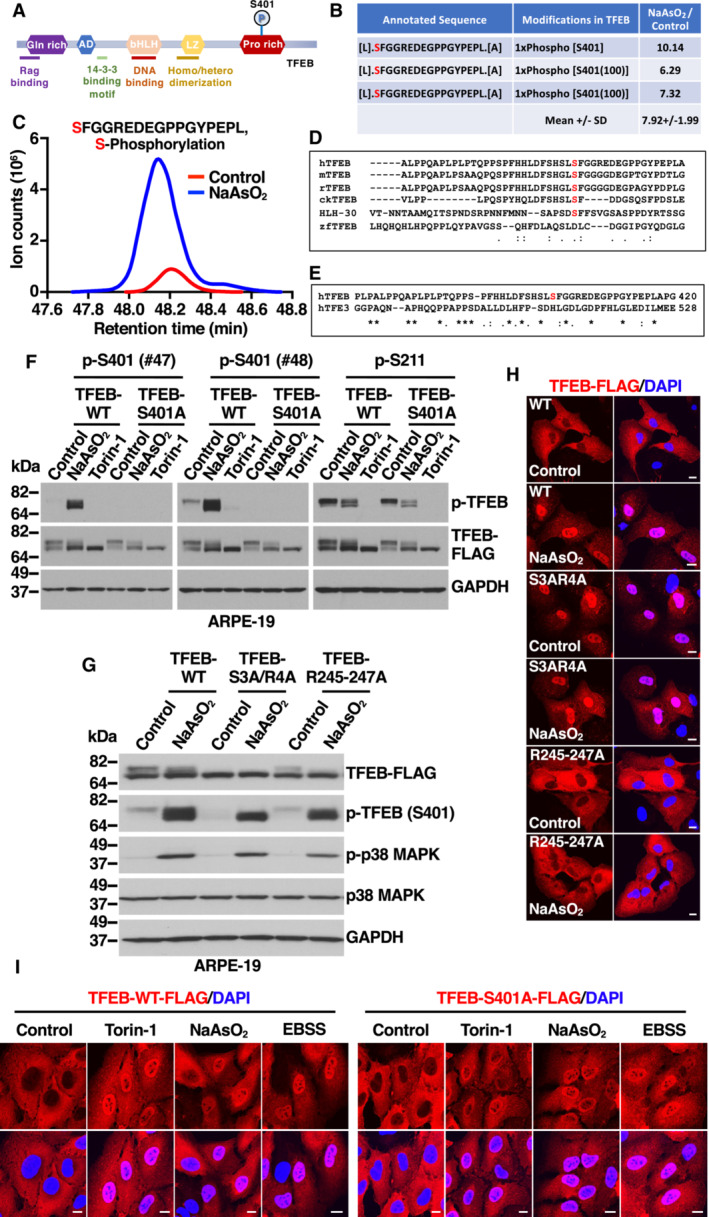
Schematic representation of TFEB domains, indicating localization of serine 401 (S401) to the C‐terminal proline‐rich domain.
Table showing mass spectrometry analysis of the abundance ratios of TFEB phosphorylated peptides in S401 from NaAsO2‐treated cells versus control cells.
Extracted ion chromatograms (XIC) of TFEB phosphorylated peptide in S401 from cells either untreated (Control) or treated with NaAsO2.
Multi‐sequence alignment of TFEB orthologs showing conserved homology between different species of the proline‐rich region containing TFEB Serine 401 (indicated in red).
Sequence homology analysis between human TFEB and TFE3 depicting the proline‐rich region containing the S401 in TFEB.
Immunoblot analysis of protein lysates from ARPE‐19 cells expressing TFEB‐WT‐FLAG or TFEB‐S401A‐FLAG treated with 200 μM NaAsO2 or 250 nM Torin‐1 for 1 h. Two different rabbit polyclonal antibodies raised against a TFEB‐S401 phospho‐specific peptide were tested.
Immunoblot analysis of protein lysates from ARPE‐19 cells expressing TFEB‐WT‐FLAG, TFEB‐S3A/R4A‐FLAG or TFEB‐R245‐247A‐FLAG treated with 200 μM NaAsO2 for 1 h. Immunoblots are representative of at least three independent experiments.
Immunofluorescence confocal microscopy of ARPE‐19 cells overexpressing TFEB‐WT‐FLAG, TFEB‐S3A/R4A‐FLAG, and TFEB‐R245‐247A‐FLAG showing the subcellular distribution of recombinant TFEB in response to treatments with 200 μM NaAsO2 for 1 h. Scale bars, 10 μm.
Immunofluorescence confocal microscopy of ARPE‐19 cells overexpressing TFEB‐WT‐FLAG or TFEB‐S401A‐FLAG showing the subcellular distribution of recombinant TFEB in response to treatments with 250 nM Torin‐1 or 200 μM NaAsO2 for 1 h or EBSS for 4 h. Scale bars, 10 μm.

