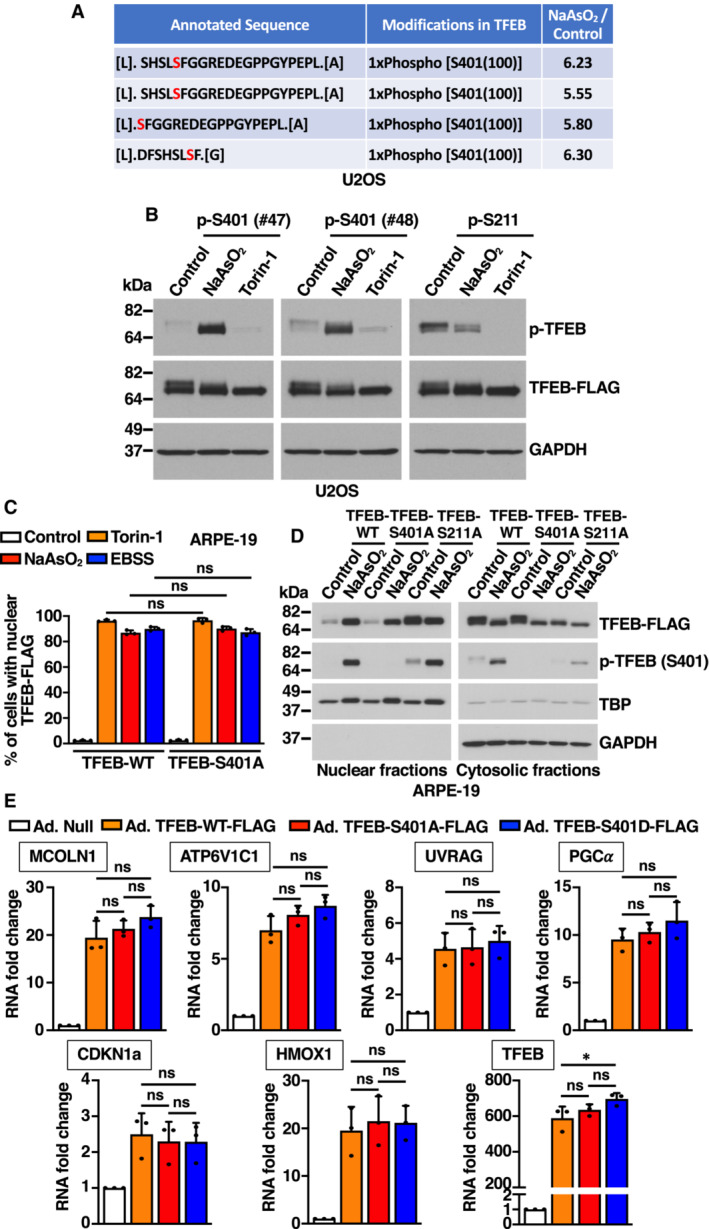
Figure EV1. Phosphorylation of TFEB S401 induced by oxidative stress. Related to Fig 1 .

- Table showing mass spectrometry analysis of the abundance ratios of TFEB phosphorylated peptides in S401 from NaAsO2‐treated cells versus control cells.
- Immunoblot analysis of protein lysates from U2OS cells expressing TFEB‐WT‐FLAG treated with 150 μM NaAsO2 or 250 nM Torin‐1 for 1 h. Two different rabbit polyclonal antibodies raised against a TFEB‐S401 phospho‐specific peptide were tested.
- Quantification of the nuclear localization of recombinant TFEB in ARPE‐19 cells expressing TFEB‐WT‐FLAG or TFEB‐S401A‐FLAG and treated with 250 nM Torin‐1 or 250 μM NaAsO2 for 1 h or EBSS for 4 h. Data are presented as mean ± SD using one‐way ANOVA (unpaired) followed by Tukey's multiple comparisons test, (ns) not significant as compared to the same treatment in TFEB‐WT‐FLAG overexpressing cells, with > 300 cells counted per trial from three independent experiments.
- Immunoblot analysis of protein lysates from ARPE‐19 cells treated with 250 μM NaAsO2 for 1 h were subjected to subcellular fractionation. Immunoblots are representative of at least three independent experiments.
- Relative quantitative RT–PCR analysis of the mRNA expression of lysosome‐ (MCOLN1 and ATP6V1C1), autophagy‐ (UVRAG), mitochondria‐ (PGC‐1α), cell cycle‐ (CDKN1a), and heme catabolism‐related (HMOX1) genes in ARPE‐19 cells overexpressing either TFEB‐WT‐FLAG, TFEB‐S401A‐FLAG, or TFEB‐S401D‐FLAG. Data are presented as mean ± SD using one‐way ANOVA (unpaired) followed by Tukey's multiple comparisons test, (ns) not significant and *P < 0.01 from three independent experiments.
Data information: n = 3 biological replicates (each dot represents a biological replicate).
Source data are available online for this figure.
