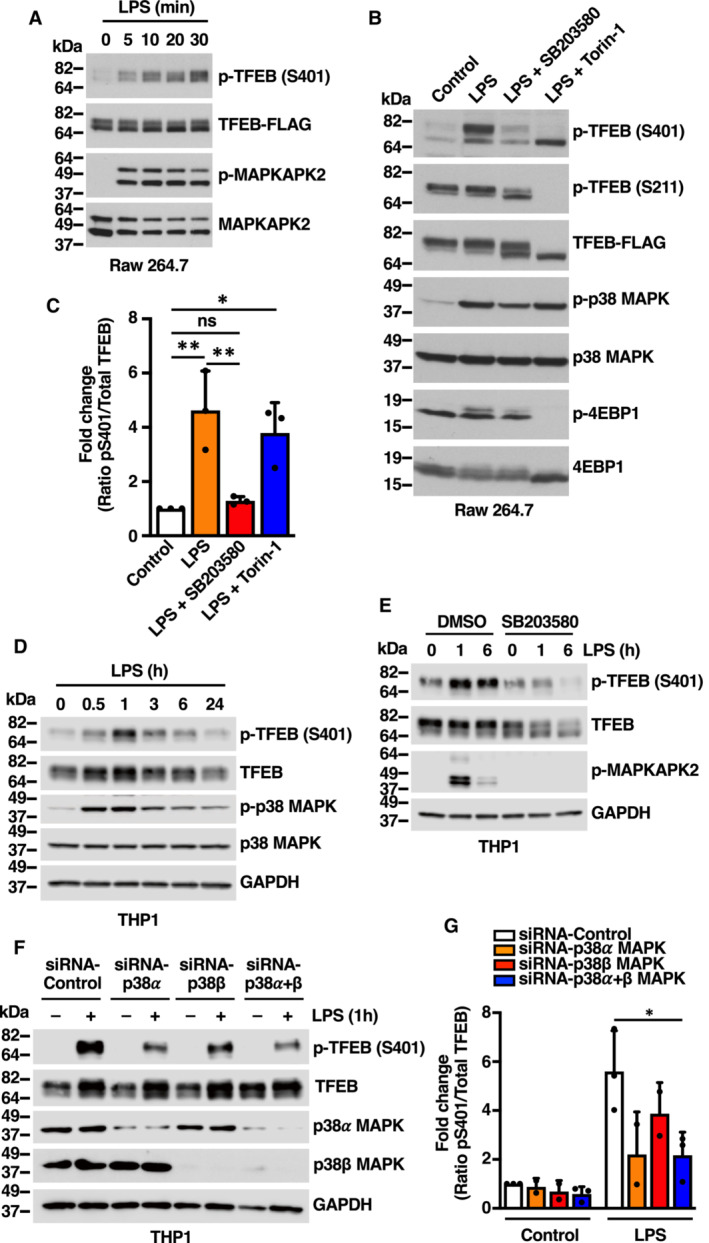
Figure 3. LPS stimulation induces p38 MAPK‐dependent phosphorylation of TFEB‐S401 in macrophages.

- Immunoblot analysis of protein lysates from Raw 264.7 cells stably expressing TFEB‐WT‐FLAG incubated with 1 μg/ml LPS for the indicated times.
- Immunoblot analysis of protein lysates from Raw 264.7 cells stably expressing TFEB‐WT‐FLAG incubated with either 20 μM SB203580 or 250 nM Torin‐1 for 1 h prior to the addition of 1 μg/ml LPS for 30 min.
- Quantification of immunoblot data shown in (B). Data are presented as mean ± SD using one‐way ANOVA (unpaired) followed by Tukey's multiple comparisons test, (ns) not significant, *P < 0.05 and **P < 0.01 from three independent experiments.
- Immunoblot analysis of protein lysates from THP1 cells incubated with 1 μg/ml LPS for the indicated times.
- Immunoblot analysis of protein lysates from THP1 cells incubated with either vehicle (DMSO) or 20 μM SB203580 for 1 h prior to the addition of 1 μg/ml LPS for the indicated times.
- Immunoblot analysis of protein lysates from THP1 cells depleted of p38 MAPK (α), p38 MAPK (β) or p38 MAPK (α + β) and incubated with 1 μg/ml LPS for 1 h. Immunoblots are representative of at least three independent experiments.
- Quantification of immunoblot data shown in (F). Data are presented as mean ± SD using one‐way ANOVA (unpaired) followed by Tukey's multiple comparisons test, *P < 0.05 from three independent experiments.
Data information: n = 3 biological replicates (each dot represents a biological replicate).
Source data are available online for this figure.
