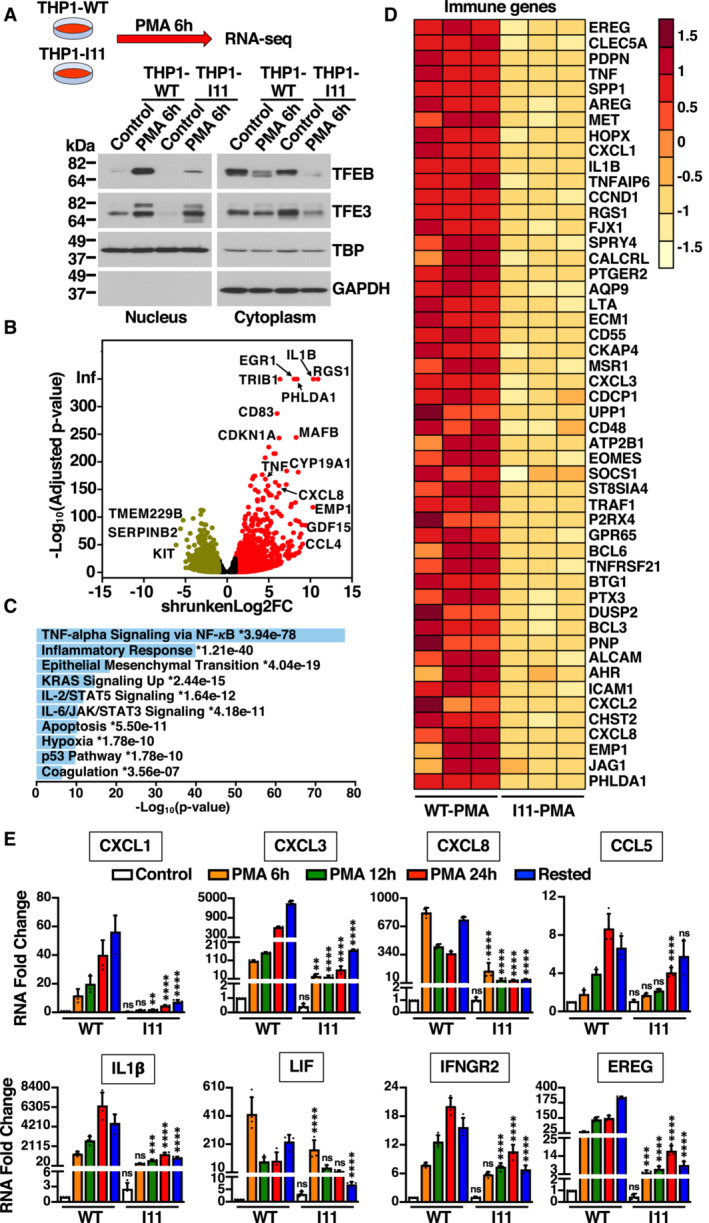
Figure 5. Immune genes expression is affected in TFEB‐S401A mutant cells.

- Immunoblot analysis of proteins from nuclear and cytosolic fractions from naïve THP1‐WT or TFEB‐S401A knock‐in (clone I11) cells treated with 50 ng/ml PMA for 6 h. This condition was used to perform RNA‐Seq analysis.
- Volcano plot indicating distribution of genes up‐ (red, shrunkenLog2FC ≥1) and down‐regulated (green, shrunkenLog2FC ≤ −1) in naïve THP1‐WT cells (Control) versus naïve THP1‐WT cells incubated with 50 ng/ml PMA for 6 h. Black symbols represent genes with a shrunkenLog2FC between 1 and −1.
- MSigDB Hallmark 2020 bar chart showing the top 10 enriched terms from RNA‐Seq analysis of naïve THP1‐WT cells (Control) versus naïve THP1‐WT cells incubated with 50 ng/ml PMA for 6 h. The corresponding significant P‐values (< 0.05) are included with an asterisk (*) indicating that the terms also have significant q‐value (< 0.05).
- Heat map of 50 differentially expressed immune genes from RNA‐Seq analysis of naïve THP1‐WT cells (WT‐PMA) versus naïve TFEB‐S401A knock‐in (I11‐PMA) cells incubated with 50 ng/ml PMA for 6 h.
- Relative quantitative RT–PCR analysis of the mRNA expression of chemokines (CXCL1, CXCL3, CXCL8, and CCL5), cytokines (IL1β and LIF), and key immune regulators (IFNGR2 and EREG) genes in naïve THP1‐WT or TFEB‐S401A knock‐in (clone I11) cells incubated with 50 ng/ml PMA for the indicated times. Data are presented as mean ± SD using one‐way ANOVA (unpaired) followed by Tukey's multiple comparisons test, (ns) not significant, **P < 0.01, ***P < 0.001 and ****P < 0.0001 as compared to the same treatment condition in THP1‐WT cells from three independent experiments.
Data information: n ≥ 3 biological replicates (each dot represents a biological replicate).
Source data are available online for this figure.
