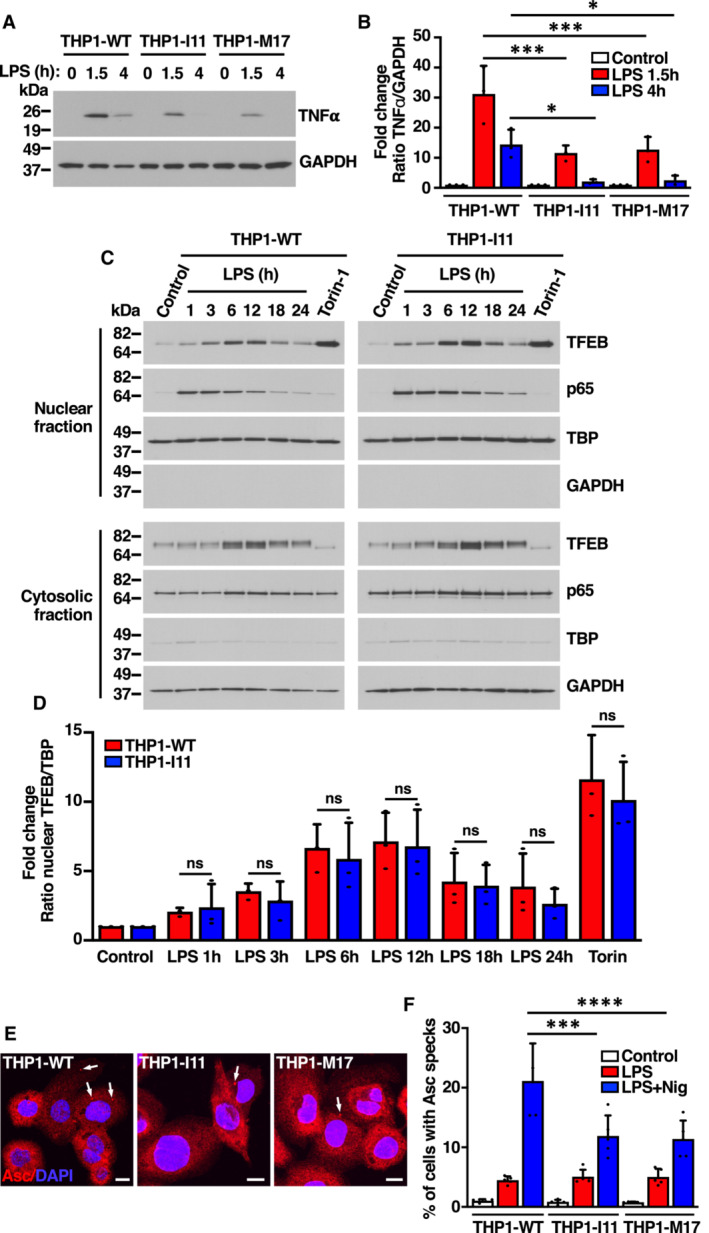
Figure EV5. Macrophage polarization is affected in THP1 TFEB‐S401A mutant cells in response to LPS. Related to Fig 6 .

- Immunoblot analysis of protein lysates from PMA‐differentiated (Rested) THP1‐WT or TFEB‐S401A knock‐ins (clones I11 and M17) cells incubated with 1 μg/ml LPS for the indicated times.
- Quantification of immunoblot data shown in (A). Data are presented as mean ± SD using one‐way ANOVA (unpaired) followed by Tukey's multiple comparisons test, *P < 0.05 and ***P < 0.001 as compared to the same treatment condition in THP1‐WT cells from three independent experiments.
- Immunoblot analysis of proteins from nuclear and cytosolic fractions from PMA‐differentiated (Rested) THP1‐WT or TFEB‐S401A knock‐in (clone I11) cells incubated with 1 μg/ml LPS for the indicated times or 250 nM Torin‐1 for 1 h.
- Quantification of immunoblot data shown in (C). Data are presented as mean ± SD using one‐way ANOVA (unpaired) followed by Tukey's multiple comparisons test, (ns) not significant as compared to the same treatment condition in THP1‐WT cells from three independent experiments.
- Immunofluorescence confocal microscopy of PMA‐differentiated (Rested) THP1‐WT or TFEB‐S401A knock‐in (clones I11 and M17) cells incubated with 0.1 μg/ml LPS for 4 h prior to the addition of 15 μM Nigericin for 45 min. Arrows point to the position of ASC specks indicative of inflammasome activation. Scale bars, 10 μm.
- Quantification of the percentage of cells with ASC specks shown in (E). Data are presented as mean ± SD using one‐way ANOVA (unpaired) followed by Tukey's multiple comparisons test, ***P < 0.001 and ****P < 0.0001 as compared to THP1‐WT cells treated with LPS + Nigericin with > 200 cells counted per trial from three independent experiments.
Data information: n ≥ 3 biological replicates (each dot represents a biological replicate).
Source data are available online for this figure.
