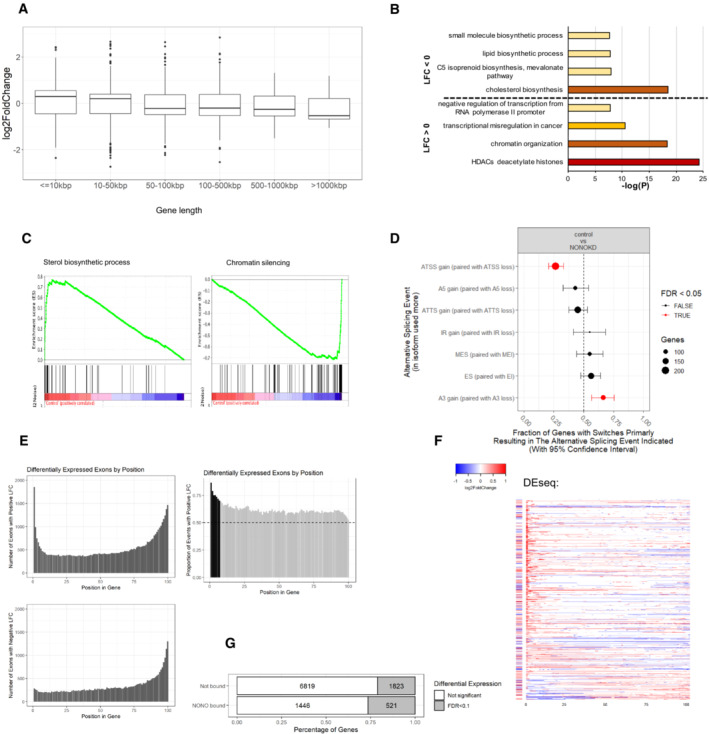
Figure EV3. NONO KD induces significant changes in ATSS and A3 in KELLY cells.

- Box plots showing log fold change for genes which were significantly differentially expressed (Padj < 0.1), separated by gene length. Biological replicates n = 4 in controls and n = 8 in NONO KD samples. Central band is median; boxes represent 1st and 3rd quartile (25th and 75th percentile, respectively) and whiskers 1.5× interquartile range. The numbers of genes are 948, 1,466, 534, 584, 48 and 14 for gene length ≤ 10, 10–50, 50–100, 100–500, 500–1,000 and > 1,000 kbp, respectively. (B) Summary of most highly enriched gene ontology categories produced by “Metascape” analysis of significantly upregulated (LFC > 0) and downregulated (LFC < 0) genes following NONO KD.
- Enrichment score profile plots produced by “GSEA” for the “sterol biosynthetic process” and “chromatin silencing” gene sets, respectively.
- NONO KD results in significant splicing events including ATSS and A3. The error bars represent 95% confidence intervals. Biological replicates n = 4 in controls and n = 8 in NONO KD samples.
- Top panel is a histogram of numbers of exons with significant positive differential expression events in NONO KD compared to control, ranked by gene position. Bottom panel is the same analysis, but for numbers of exons with negative differential expression events. Right panel shows the proportion of positive differential expression events, ranked by gene position. The dotted line at 0.5 indicates equal numbers of positive, and negative expression events. The black bars show where positive expression events are significantly occurring, over negative events (> 2 SD over the median).
- Individual transcripts with significant positive, or negative, differential expression exons at the 5′ end of the gene (bins 1–7 from Fig EV3E). Each row represents a gene, split into 100 bins (exons and introns). Coloured bins represent significant events in differential expression. The bar to the left of each row indicates whether the gene as a whole is differentially expressed. Red indicates increased expression, and blue indicates decreased expression.
- Proportions of differentially expressed genes between NONO‐bound and non‐bound target genes.
