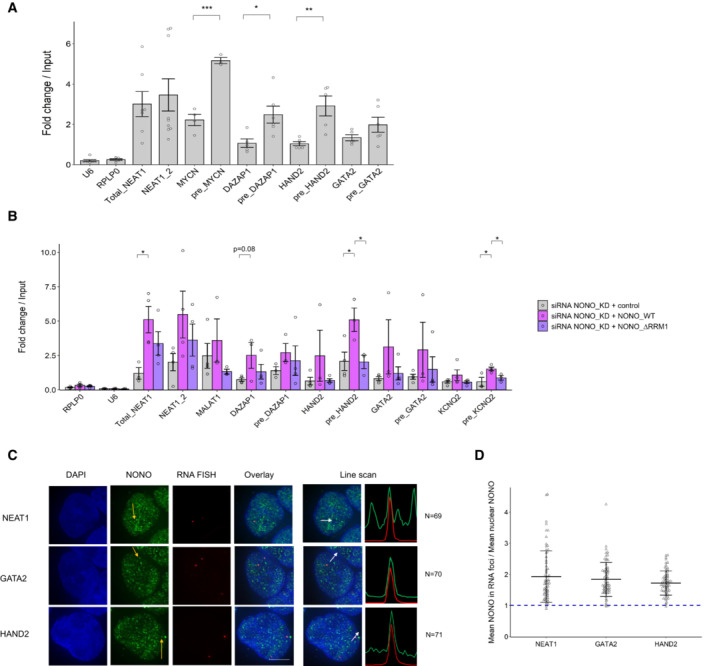
Figure 4. NONO binds more abundantly on pre‐mRNAs than mature counterparts in KELLY cells.

- Relative pre‐mRNA levels and their mature counterparts were measured by NONO RNA RIP followed by RT‐qPCR. RIP data with normal mouse serum IgG as controls are not displayed because all values are < 0.01. Bars are SEM. Biological replicates n ≥ 3. Student's t‐test is used to compare the means. *P < 0.05, **P < 0.01, ***P < 0.001.
- Relative pre‐mRNA levels and their mature counterparts were measured by NONO RNA RIP followed by RT‐qPCR in cells transfected sequentially with NONO KD siRNA and then siRNA‐resistant control (YFP only), YFP‐fused NONO_WT or NONO_∆RRM1 plasmids. Bars are SEM. Biological replicates n ≥ 3. Student's t‐test is used to compare the means. *P < 0.05.
- Fluorescence micrograph images of representative cells stained for NONO and NEAT1_2 (top), GATA2 (middle) and HAND2 (bottom). DAPI (blue) stain indicates cell nuclei, NONO immunofluorescence (green) and RNA FISH (red) for NEAT1_2, GATA2 and HAND2. Line scans correspond to the positions and directions of the arrows. Scale bar: 5 μm.
- In micrograph image quantitation analysis, the enrichment of mean NONO fluorescence detected within RNA FISH foci is determined as a ratio relative to mean nuclear NONO fluorescence in (C). Bars are SD. The numbers of biological replicates are indicated in (C).
