
Figure EV4. NONO displays some DNA binding to GATA2, which in turn is not sensitive to transcription levels, or linked to transcriptional elongation.
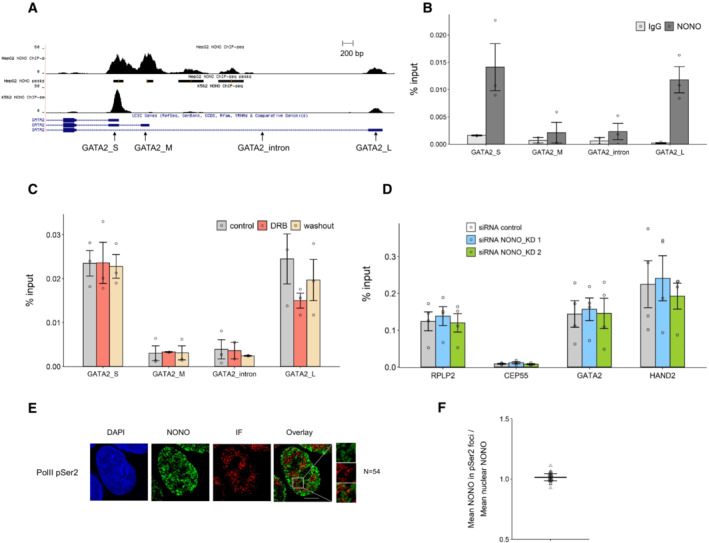
- NONO ChIP‐seq peaks for GATA2 in HepG2 and K562 cell lines shown as a Genome Browser image (Xiao et al, 2019). The primer pairs for GATA2 used in our ChIP‐qPCR are indicated.
- The enrichment of relative GATA2 chromatin fragments via ChIP‐qPCR against NONO and normal mouse serum IgG in KELLY cells. Bars are SEM. Biological replicates n = 3.
- NONO ChIP‐qPCR indicates the enrichment of relative GATA2 chromatin fragments in KELLY cells treated with control, DRB and DRB followed by a washout period. Bars are SEM. Biological replicates n = 3.
- The enrichment of relative GATA2 and HAND2 chromatin fragments after NONO KD via ChIP‐qPCR against RNA PolII phosphorated at Serine 2 in KELLY cells. Bars are SEM. Biological replicates n ≥ 3.
- Fluorescence micrograph images of representative cells stained for NONO and RNA PolII phosphorated at Serine 2. DAPI (blue) stain indicates cell nuclei, NONO immunofluorescence (green) and immunofluorescence for Pol II pSer2 (red). Scale bar: 5 μm.
- In micrograph image quantitation analysis, the enrichment of mean NONO fluorescence detected within immunofluorescence foci of Pol II pSer2 is determined as a ratio relative to mean nuclear NONO fluorescence in (E). The quantitation shows no enrichment of NONO in the foci. Bars are SD. Biological replicates n = 54.