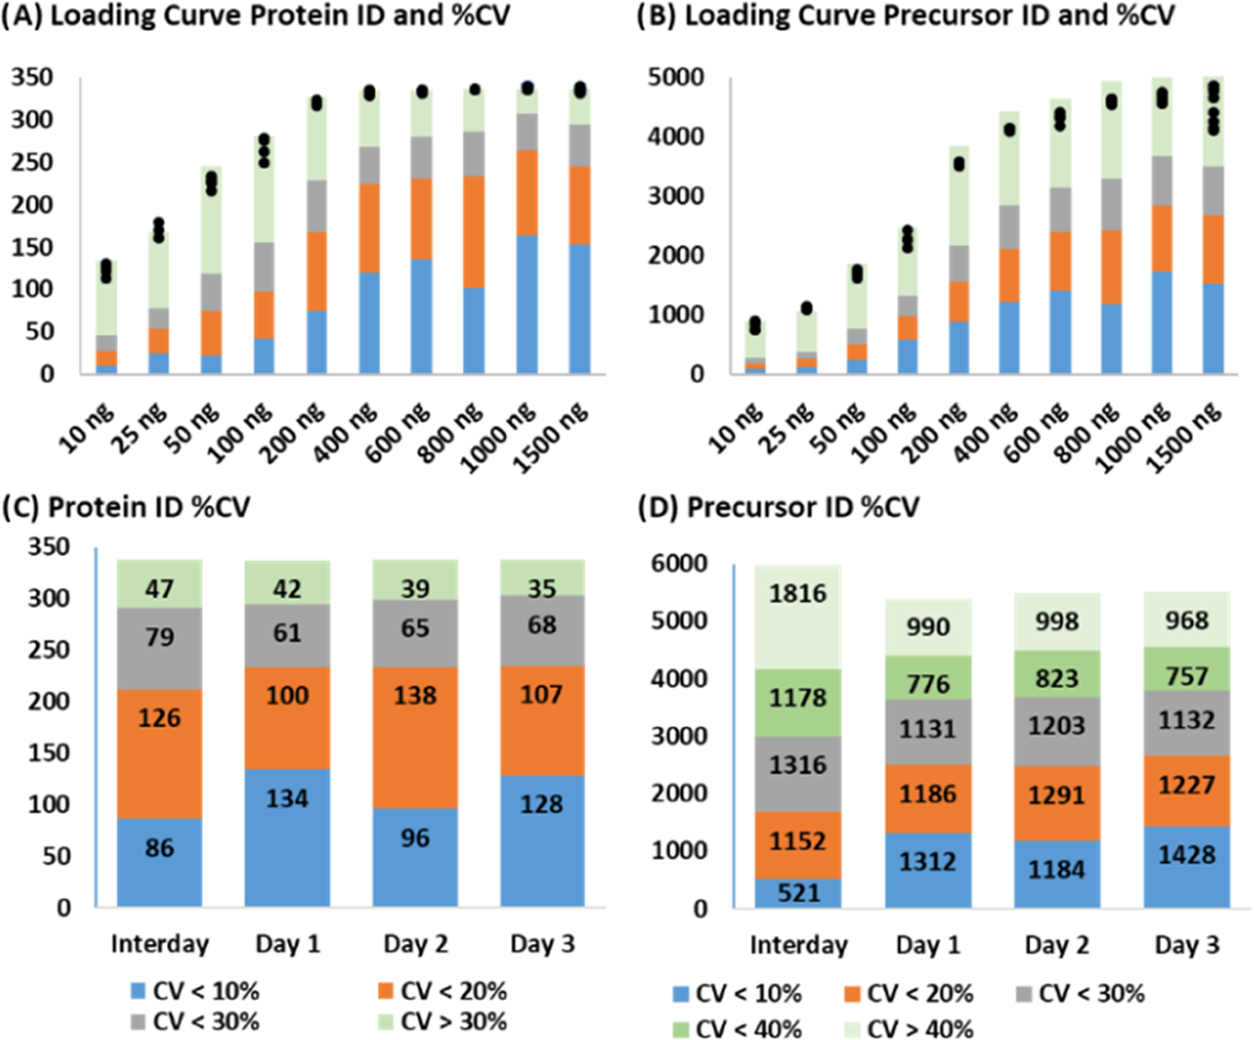
Figure 3.

Loading curve and reproducibility. (A, B) Protein and precursor ion identifications, respectively, at each DBS sample load with identifications in individual replicates marked by black circles. The colors represent %CV criteria: blue < 10%; orange 10–20%; gray 20–30%; and green > 30%. (C, D) Protein and precursor ion reproducibility on 3 different days (10 replicate injections) and interday reproducibility. The same color code is repeated from Panels A and B, except in D: green 30–40% (green) and pale green > 40%.
