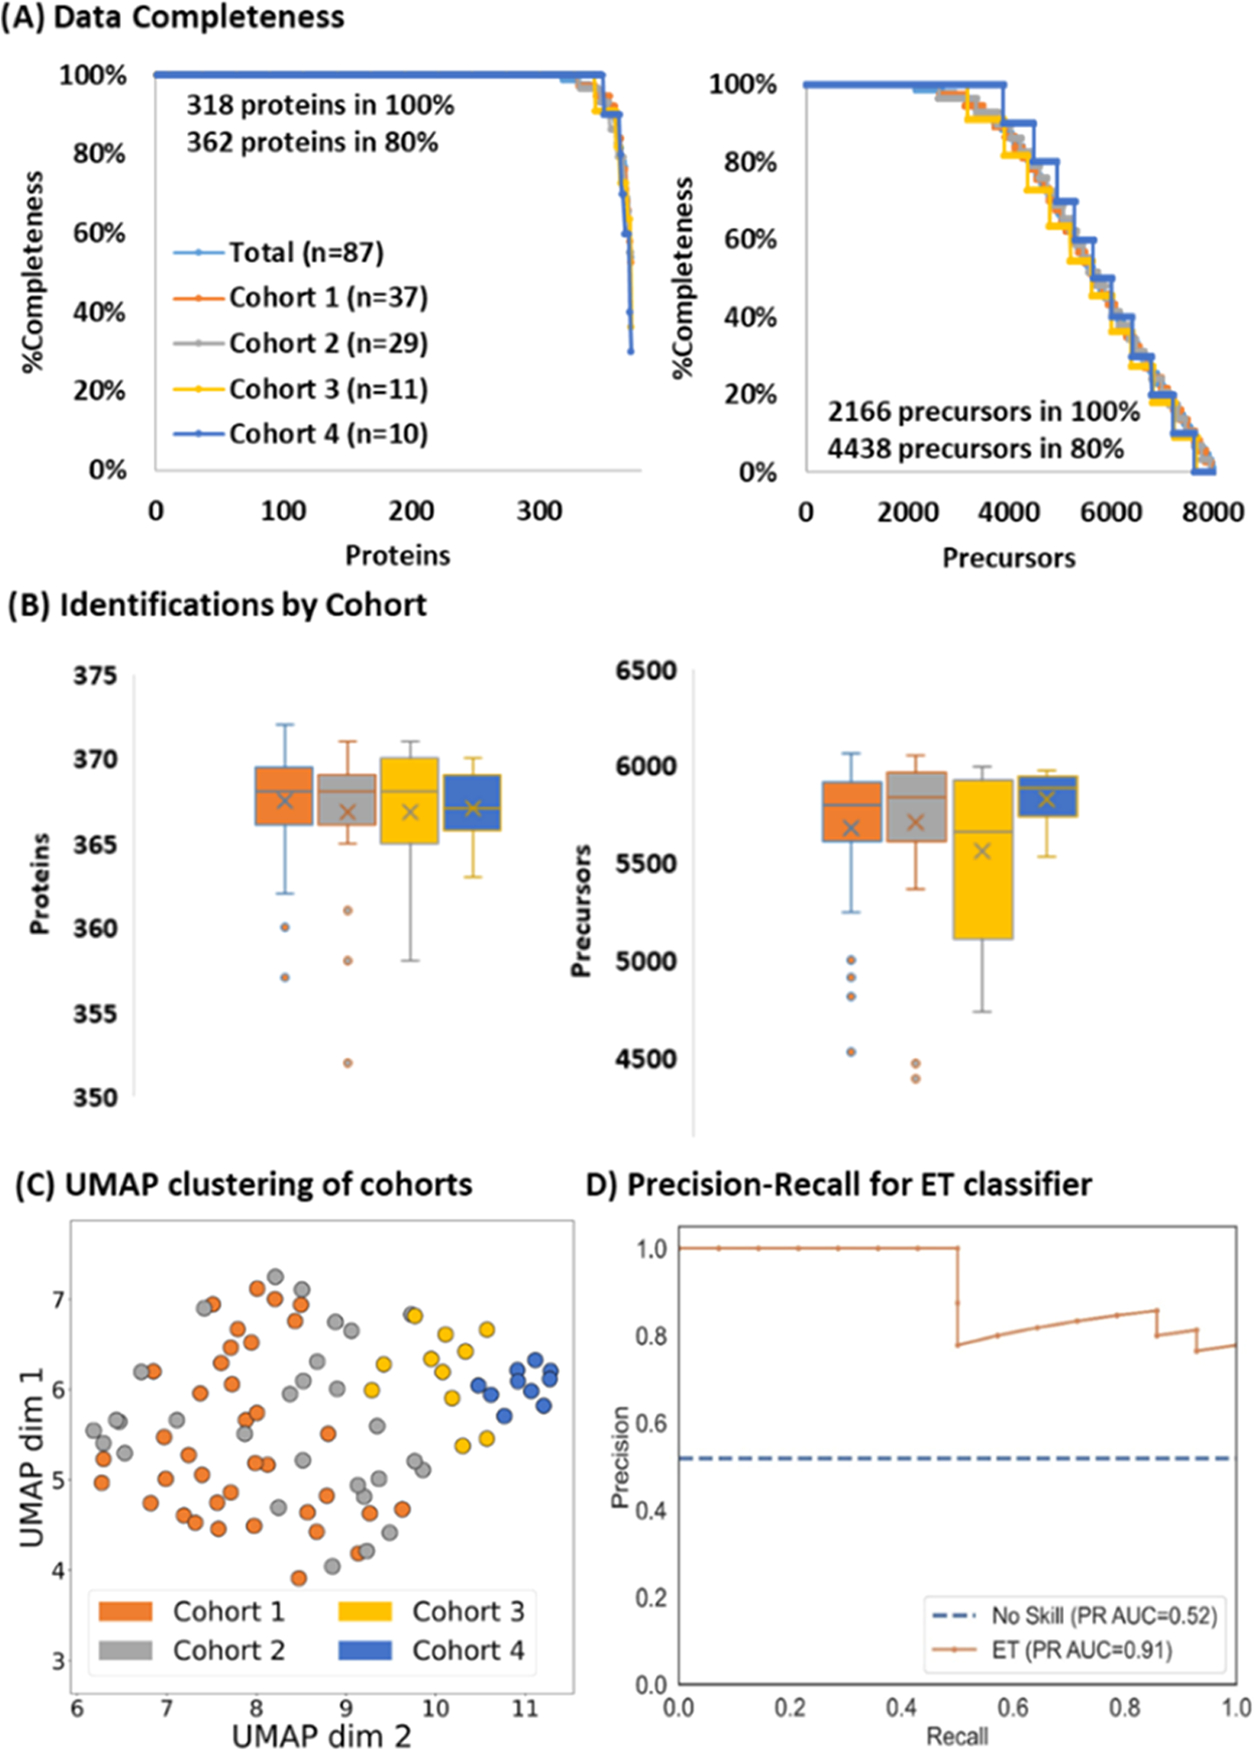
Figure 4.

Hypertension Cohort Analysis (A) Data completeness curves for total (light blue), Cohort 1 (orange), Cohort 2 (gray), Cohort 3 (yellow), and Cohort 4 (dark blue). (B) Identification distributions at the protein (left) and precursor ion (right). (C) UMAP clustering of the different cohorts. (D) Precision recall curve of the best classifier (Extra Trees) trained to distinguish Cohort 1 (the control group) from the remaining hypertension cohorts achieves a PR AUC of 0.91.
